Letters to the editor that are sent more than a month after initial publication of article are posted on the website to facilitate better discussion.
Submit your own letter to the editor here.
2013: Letters to the Editor by Month
March 20132012: Letters to the Editor by Month
December 2012
November 2012
September 2012
April 2012
February 2012
January 20122011: Letters to the Editor by Month
December 2011
November 2011
October 2011
August 2011
May 2011
February 2011
Letters to the Editor Archive
March 2013
We have read with great interest the study by Rembach and colleagues [1] on the diagnostic value of serum copper (Cu), ceruloplasmin (CP), and ‘free’ Cu also named non-CP Cu, in the Australian Imaging Biomarkers and Lifestyle Study of Aging (AIBL). When discussing their results, these authors commented that some studies of ours on the relationship between serum non-CP Cu and Alzheimer’s disease (AD) [2-8] were produced in cohorts not adjusted for age and gender. Actually, our studies were all adjusted for age and gender, and finally they involved a large population of more than 860 individuals [9]. In fact, to date we have collected Cu studies from a cohort of about 300 healthy controls, 400 AD, and 169 mild cognitive impairment (MCI) subjects. Specifically, beginning with our studies in 2002, we have used “laboratory reference sera” in every Cu and CP experimental run in addition to the standard controls provided by manufacturers. This procedure allowed us to merge data obtained in different runs during different years. Expressively, we have created a set of five pooled sera from about 20 healthy individuals, well defined in terms of Cu and CP, and we have divided these control pooled sera into thousands of aliquots, stored them at -80°C, and tested them in every run. As reported [9], the descriptive statistics of this merged dataset indicated: healthy controls (n=303; non-CP Cu mean=0.25, SD=2.32 µmol/L), AD patients (n=399; non-CP Cu mean=2.27, SD=2.29 µmol/L), and MCI subjects (n=169; Non-CP Cu mean=1.36, SD=2.13 µmol/L). After adjusting for age and gender through a general linear model, the estimates were as follows: healthy mean=0.20 (95% CI=-0.09, +0.492), AD mean=2.18 (95% CI=1.91, 2.23), MCI mean=1.38 (95% CI=1.04; 1.73) with each pairwise comparison clearly significant (p<0.001 after Bonferroni correction).
Moreover, when Rembach et al. [1] considered age and gender as covariates in their statistical models, their relationships observed between non-CP Cu and disease status were all abrogated, so their conclusion (see the Abstract) of decreased levels of non-CP Cu in MCI and AD appears not sustained by their data.In all previous studies on this matter, the authors have used the equation published by Walshe to calculate non-CP Cu [10]. Rembach et al. [1] questioned this equation because its utilization in the AIBL cohort produced mostly non-CP Cu values in the negative range. Specifically, they reported that the Walshe equation assumes that the amount of Cu in CP is 0.3% g/g, which they refer to be equal to 7.1 moles of Cu/CP. Actually, Walshe [10] clearly reported that the number of atoms (moles) of Cu in CP are 6 (in particular, 0.3% g/g of Cu in Cp corresponds exactly to 6.23 atoms which can be approximated to 6) and, thereby, their concern about the Walshe equation and its utilization appear not pertinent. From the above, equation #1 of Rembach et al. (which is actually the Walshe’s equation [10]) and equation #2, which these authors report to be derived from:
[CP copper]=[CP mole/L]*6 moles of copper/CP mole [1],
are the same, as follows:
CP-Cu1(µM)=CP (mg/L) * 1000 *(0.3/100)*[1/63.6 (g/mol)]=
=CP (mg/dL) *10*1000* (0.3/100)*[1/63.6(g/mol)]=
= CP (mol/L)* (6moles Cu/1moles Cp) *10(6)So, also non-CP Cu (µM)1 and non-CP Cu (µM)2 reported in Table 2 by Rembach et al. [1] should be the same, differently from what is reported. Moreover, 50% of the control non-CP Cu values calculated with equation #2 are higher than the normal reference range reported for healthy controls [10].
The diverse results obtained by Rembach et al. [1] in terms of non-CP Cu in comparison with all the previous studies published [3, 5, 8, 11-17] can more likely be related to the diverse values of CP measured in the AIBL cohort. As a matter of fact, if one considers all the studies published in 1983 through January 2013 on Cu and CP measurements in AD and control individuals [3, 5, 8, 11-17], the mean value of non-CP for healthy controls is in the positive range. This is not true for the Rembach et al. study [1], which finds a negative mean value (Table 1).
Twomey et al. [18] proposed 6.6 as the theoretical optimal mean value of the Cu:CP ratio in healthy subjects. This ratio is an index of the accordance of the Cu and CP pair for each serum measurement. As reported in Table 1, the Cu:CP ratio for the Rembach et al. study [1] is lower than 6.6, which indicates an underestimation of Cu with respect to CP values, pointing out that in the AIBL study, the CP values are not in line with the other studies. Genetic factors may account for this difference which seems to move the AIBL CP values toward higher values, especially in relation to total serum Cu. In particular, ethnicity may explain this evidence. As described by the AIBL group, Australia is a geographically isolated country with a different ethnic mix and AIBL participants reflected this admixture [19]. Serum CP levels are affected by genetics [20]. Several studies have demonstrated that genetic variation among human populations is associated with significant functional differences in health-related aspects [21]. Among human populations, Australians showed a very complex genetic structure [22], which, thereby, may explain the differences between AIBL CP values and those from the other studies. Otherwise, existing CP concentration methods are not standardized [23]. On this basis, we can conclude that the data showed by the AIBL study are not sufficient to sustain the authors’ statement that non-CP Cu is not a robust discriminator for AD. More precisely, we agree with them that the calculation is composite; it is susceptible to Cu, CP, and their reciprocal variations which should move in concert to fit their physiological interaction. In other words, as depicted in this Letter to the Editor, the main problem concerns the calculations and not the occurrence of a Cu dysfunction in AD. This is why we have developed a direct fluorescent assay to measure serum non-CP Cu [9]. This assay uses a coumarin fluorescent probe, for which a decay in fluorescence emission is recorded when it binds [Cu++]. This probe allows one to overcome the weakness of the non-CP Cu calculation and the uncertainty of the results.
Rosanna Squittia,b, Patrizio Pasqualettic, Mariacristina Siottod, Renato Polimantie, Mariacarla Ventrigliaa,b, Nicola Colabufof
aDepartment of Neuroscience, AFaR – Fatebenefratelli Hospital, Isola Tiberina, Rome, Italy
bDepartment of Neurology, “Campus Biomedico” University, Rome, Italy
cMedical Statistics & Information Technology, AFaR – Fatebenefratelli Hospital, Isola Tiberina,
Rome, Italy
dDon Carlo Gnocchi Foundation ONLUS, Milan, Italy
eDepartment of Biology, University of Rome “Tor Vergata”, Rome, Italy
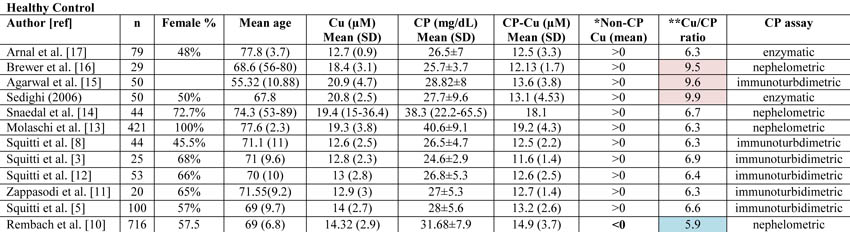
fDipartimento Farmacia, Università degli Studi di Bari ALDO MORO, Bari, ItalyTable 1. Copper (Cu), ceruloplasmin (CP), CP-bound copper (CP-Cu), non-CP-bound copper (Non-CP Cu), and Cu:CP ratio in healthy subjects as reported in all the studies published from 1983 through January 2013 on Cu and CP measurements in Alzheimer’s disease and control individuals.
*Data concerning CP-Cu have been calculated following the Walshe equation [10]. Non-CP Cu was calculated by subtracting CP-Cu from Cu as reported by Walshe [10] and expressed in terms of negative or positive values. The Rembach et al. study [1] is the only study reporting mean value <0.
**Cu:CP ratio is calculated as reported in Twomey et al. [18]. These authors provide the equation as follows:
[copper µM]* [132000 g/mol]/[ CPmg/dL*10(4)]
Twomey et al. [18] propose that 6.6 is the theoretical optimal mean value of this ratio in healthy subjects. In Table 1, the values consistently higher than 6.6 are reported in pale pink, and they represent an overestimation of copper with respect to CP values. Values consistently lower than 6.6 are represented in pale blue and represent an underestimation of copper with respect to CP values.References
[1] Rembach A, Doecke JD, Roberts BR, Watt AD, Faux NG, Volitakis I, Pertile KK, Rumble RL, Trounson BO, Fowler CJ, Wilson W, Ellis KA, Martins RN, Rowe CC, Villemagne VL, Ames D, Masters CL, Bush AI (2013) Longitudinal analysis of serum copper and ceruloplasmin in Alzheimer's disease. J Alzheimers Dis34, 171-182.
[2] Salustri C, Squitti R, Zappasodi F, Ventriglia M, Bevacqua MG, Fontana M, Tecchio F (2010) Oxidative stress and brain glutamate-mediated excitability in depressed patients. J Affect Disord 127, 321-325.
[3] Squitti R, Barbati G, Rossi L, Ventriglia M, Dal Forno G, Cesaretti S, Moffa F, Caridi I, Cassetta E, Pasqualetti P, Calabrese L, Lupoi D, Rossini PM (2006) Excess of nonceruloplasmin serum copper in AD correlates with MMSE, CSF [beta]-amyloid, and h-tau. Neurology 67, 76-82.
[4] Squitti R, Bressi F, Pasqualetti P, Bonomini C, Ghidoni R, Binetti G, Cassetta E, Moffa F, Ventriglia M, Vernieri F, Rossini PM (2009) Longitudinal prognostic value of serum "free" copper in patients with Alzheimer disease. Neurology 72, 50-55.
[5] Squitti R, Ghidoni R, Scrascia F, Benussi L, Panetta V, Pasqualetti P, Moffa F, Bernardini S, Ventriglia M, Binetti G, Rossini PM (2011) Free copper distinguishes mild cognitive impairment subjects from healthy elderly individuals. J Alzheimers Dis 23, 239-248.
[6] Squitti R, Lupoi D, Pasqualetti P, Dal Forno G, Vernieri F, Chiovenda P, Rossi L, Cortesi M, Cassetta E, Rossini PM (2002) Elevation of serum copper levels in Alzheimer's disease. Neurology 59, 1153-1161.
[7] Squitti R, Pasqualetti P, Cassetta E, Dal Forno G, Cesaretti S, Pedace F, Finazzi-Agro A, Rossini PM (2003) Elevation of serum copper levels discriminates Alzheimer's disease from vascular dementia. Neurology 60, 2013-2014.
[8] Squitti R, Pasqualetti P, Dal Forno G, Moffa F, Cassetta E, Lupoi D, Vernieri F, Rossi L, Baldassini M, Rossini PM (2005) Excess of serum copper not related to ceruloplasmin in Alzheimer disease. Neurology 64, 1040-1046.
[9] Colabufo N, Squitti R (2012) Patent: Method and kit for determination of free copper in serum. European Patent Office (EPO) (RO/EP), Patent number: PCT-SAFE Version 3.51.056.232 MT/FOP 20121001/0.20.5.19
[10] Walshe JM (2003) Wilson's disease: the importance of measuring serum caeruloplasmin non-immunologically. Ann Clin Biochem 40, 115-121.
[11] Zappasodi F, Salustri C, Babiloni C, Cassetta E, Del Percio C, Ercolani M, Rossini PM, Squitti R (2008) An observational study on the influence of the APOE-epsilon4 allele on the correlation between 'free' copper toxicosis and EEG activity in Alzheimer disease. Brain Res 1215, 183-189.
[12] Squitti R, Ventriglia M, Barbati G, Cassetta E, Ferreri F, Dal Forno G, Ramires S, Zappasodi F, Rossini PM (2007) 'Free' copper in serum of Alzheimer's disease patients correlates with markers of liver function. J Neural Transm 114, 1589-1594.
[13] Molaschi M, Ponzetto M, Bertacna B, Berrino E, Ferrario E (1996) Determination of selected trace elements in patients affected by dementia. Arch Gerontol Geriatr 22 Suppl 1, 39-42.
[14] Snaedal J, Kristinsson J, Gunnarsdottir S, Olafsdottir, Baldvinsson M, Johannesson T (1998) Copper, ceruloplasmin and superoxide dismutase in patients with Alzheimer's disease . a case-control study. Dement Geriatr Cogn Disord 9, 239-242.
[15] Agarwal R, Kushwaha SS, Tripathi CB, Singh N, Chhillar N (2008) Serum copper in Alzheimer's disease and vascular dementia. Indian J Clin Biochem 23, 369-374.
[16] Brewer GJ, Kanzer SH, Zimmerman EA, Celmins DF, Heckman SM, Dick R (2010) Copper and ceruloplasmin abnormalities in Alzheimer's disease. Am J Alzheimers Dis Other Demen 25, 490-497.
[17] Arnal N, Cristalli DO, de Alaniz MJ, Marra CA (2010) Clinical utility of copper, ceruloplasmin, and metallothionein plasma determinations in human neurodegenerative patients and their first-degree relatives. Brain Res 1319, 118-130.
[18] Twomey PJ, Viljoen A, House IM, Reynolds TM, Wierzbicki AS (2007) Copper:caeruloplasmin ratio. J Clin Pathol 60, 441-442.
[19] Gardener S, Gu Y, Rainey-Smith SR, Keogh JB, Clifton PM, Mathieson SL, Taddei K, Mondal A, Ward VK, Scarmeas N, Barnes M, Ellis KA, Head R, Masters CL, Ames D, Macaulay SL, Rowe CC, Szoeke C, Martins RN (2012) Adherence to a Mediterranean diet and Alzheimer's disease risk in an Australian population. Transl Psychiatry 2, e164.
[20] Tang WH, Hartiala J, Fan Y, Wu Y, Stewart AF, Erdmann J, Kathiresan S, Roberts R, McPherson R, Allayee H, Hazen SL (2012) Clinical and genetic association of serum paraoxonase and arylesterase activities with cardiovascular risk. Arterioscler Thromb Vasc Biol 32, 2803-2812.
[21] Polimanti R, Piacentini S, Manfellotto D, Fuciarelli M (2012) Human genetic variation of CYP450 superfamily: analysis of functional diversity in worldwide populations. Pharmacogenomics 13, 1951-1960.
[22] Ballantyne KN, van Oven M, Ralf A, Stoneking M, Mitchell RJ, van Oorschot RA, Kayser M (2012) MtDNA SNP multiplexes for efficient inference of matrilineal genetic ancestry within Oceania. Forensic Sci Int Genet 6, 425-436.
[23] Infusino I, Valente C, Dolci A, Panteghini M (2010) Standardization of ceruloplasmin measurements is still an issue despite the availability of a common reference material. Anal Bioanal Chem 397, 521-525.
Response to Squitti et al.
We appreciate that Dr. Squitti and colleagues have published data previously that may appear at variance with our findings published in the article “Longitudinal analysis of serum copper and ceruloplasmin in Alzheimer’s disease.” [1] Our responses to the authors’ list of concerns are detailed below.
“…these authors commented that some studies of ours on the relationship between serum non-CP Cu and Alzheimer’s disease (AD) [2-8] were produced in cohorts not adjusted for age and gender. Actually, our studies were all adjusted for age and gender, and finally they involved a large population of more than 860 individuals [9]…”
Squitti and colleagues cite an analysis they performed involving pooling of data from their multiple studies that they adjusted for age and gender in a general linear model. However, their analysis was not published in the peer-reviewed literature, but rather in a patent application, which we did not have access to at the time of publication. Despite the caveat of analyzing pooled data from multiple studies, in contrast to our analysis of one large cohort, we are willing to accept that their meta-analysis reveals differences that survive adjustment for age and gender, at variance with our findings.
“…when Rembach et al. [1] considered age and gender as covariates in their statistical models, their relationships observed between non-CP Cu and disease status were all abrogated, so their conclusion (see the Abstract) of decreased levels of non-CP Cu in MCI and AD appears not sustained by their data…”
Our abstract states that there was “…a near-significant decrease in non-CP copper in the mild cognitive impairment and AD groups at baseline (p = 0.02) that was significant at 18-months (p = 0.003).” These were the only changes we could find at all between clinical groups, hence they were highlighted in the abstract. The abstract did not contend that these differences were of adjusted data, and Squitti and colleagues are correct in that adjustment abrogated the significance of the changes, as reported in the results.
“…they reported that the Walshe equation assumes that the amount of Cu in CP is 0.3% g/g, which they refer to be equal to 7.1 moles of Cu/CP. Actually, Walshe [10] clearly reported that the number of atoms (moles) of Cu in CP are 6 (in particular, 0.3% g/g of Cu in Cp corresponds exactly to 6.23 atoms which can be approximated to 6…”
The stoichiometric ratio of Cu bound to CP in the studies of Squitti and colleagues is based on the assumption of 0.3 g Cu per g CP. Indeed this equates to 6.23 atoms, and we thank Squitti and colleagues for pointing out that we were in error to calculate a molar ratio of 7.1 based on Walshe’s assumption. However, this does not change any of our conclusions regarding changes in serum Cu, CP, or non-CP Cu in AD. We are concerned by the impact of rounding the moles of copper to 6 based on 0.3% g/g, when it is possible that some CP is occupied by 7 coppers [2]. Indeed, a recent direct measure of CP using size exclusion inductively coupled mass spectrometry indicates that 6-7 Cu per CP molecule exist [3]. It is also possible that some CP exists in serum/plasma with <6 moles of Cu, however, such species are likely to be relatively short-lived (vide infra). Regardless of whether one uses 0.3% (6.23 moles of Cu/mole of CP) or 6 moles of Cu/CP or 7.1 moles of Cu/CP, the constant used does not change the dimension of the differences for non-CP Cu between each clinical group, or our overall conclusion that non-CP Cu might be decreased in AD, and is certainly not increased in our cohort. We have indeed re-analyzed our data with the 6.23 Cu per CP as the constant, and, as expected, our conclusions remain unchanged. Changing this constant slightly changes the distribution of the data, but does not change the outcome.
In any case, calculation of non-CP Cu using any constant for Cu binding to CP makes an assumption that Cu in serum/plasma is either bound to CP or unbound, and this is not true. There are other abundant Cu binding proteins in serum/plasma including transcuprein (5-15%), albumin (15-20%), low molecular weight complexes (2-5%), so that CP accounts for only 60-70% of the total Cu in the periphery [4]. The non-CP Cu estimation procedure is not a direct measure, as Squitti and colleagues concede. In Wilson’s disease, where perturbation of copper loading into CP is profound, calculating ‘free Cu” is relevant and appropriate, but for AD we could not corroborate such an elevation. Thus, the only way to make any conclusions about the level of Cu in serum/plasma fractions other than CP or in CP itself, is to directly measure them.
“…non-CP Cu (µM)1 and non-CP Cu (µM)2 reported in Table 2 by Rembach et al. [1] should be the same, differently from what is reported …”
The non-CP Cu estimation subtracts the concentration of Cu assumed to bind to CP from the total Cu in the serum. The values for CP concentration and for total serum Cu are known, but the amount of Cu attributed to CP binding is assumed. In Table 2, we tested two assumptions (7.1 versus 6) about the stoichiometry of Cu binding to CP. The residual “non-CP Cu” must certainly be different depending on the assumption of stoichiometry.
“…50% of the control non-CP Cu values calculated with equation #2 are higher than the normal reference range reported for healthy controls [10]…”
Walshe [5] described that “…the normal concentration of free copper is around 1.6 µM…”. The article does not provide a reference range. Our estimated values assuming 6 moles of Cu per CP were 1.76 µM at baseline and 0.96 µM 18-months later for the control group. This is not far from Walshe’s estimates. Were we to assume, as Walshe did, a stoichiometric ratio of 6.23, these mean values would be slightly lower, but our conclusions would not change.
“…if one considers all the studies published in 1983 through January 2013 on Cu and CP measurements in AD and control individuals [3, 5, 8, 11-17], the mean value of non-CP for healthy controls is in the positive range. This is not true for the Rembach et al. study [1], which finds a negative mean value (Table 1)….”
The contested values are actually reported in Table 2 of Rembach et al. [1], not Table 1. In Table 2, we report positive non-CP Cu values using an assumption of 6 Cu per CP. The negative values were due to the assumption of 7.1 moles of Cu per CP. We agree that the positive values have more validity, and we report in the paper that we use the positive values for non-CP Cu (generated by the 6 Cu per CP assumption) as the basis for our conclusions.
“…Twomey et al. [18] proposed 6.6 as the theoretical optimal mean value of the Cu:CP ratio in healthy subjects. This ratio is an index of the accordance of the Cu and CP pair for each serum measurement. As reported in Table 1, the Cu:CP ratio for the Rembach et al. study [1] is lower than 6.6, which indicates an underestimation of Cu with respect to CP values, pointing out that in the AIBL study, the CP values are not in line with the other studies. Genetic factors may account for this difference which seems to move the AIBL CP values toward higher values, especially in relation to total serum Cu. In particular, ethnicity may explain this…”
There is uncertainty in the literature about the average stoichiometry of Cu:CP in serum/plasma. In a subsequent paper, Twomey et al. [6] pointed out discrepancies in the ratios in plasma Cu:CP values of populations measured in three different labs. They concluded that CP assays are not adequately standardized, and that labs should derive their own reference values for CP. We believe that this is a far more likely explanation for our Cu:CP ratio being less than 6.6. Another possible explanation could be the advanced age of our cohort.
We cannot exclude ethnic composition of the cohort as contributing to Cu:CP ratio, but we do not believe that this accounts for the conclusions at variance with those of Squitti and colleagues. Again, whatever value is used as the assumption of Cu:CP stoichiometry in serum/plasma, it is a constant when comparing between clinical groups, which was our overarching aim. Our data shows that no matter what the constant is, the differences between the diagnostic groups indicate a decrease in non-CP Cu in AD.
We agree with Squitti and colleagues that more sophisticated methods are needed to assess whether peripheral Cu or CP are perturbed in AD and whether changes in the periphery are directly linked to the pathological mechanism(s) in AD. Their direct assay for unbound Cu ions may be informative. In addition, a detailed analysis of the functional activity of CP may be informative as there is still some evidence that this protein may be compromised in AD.
We also agree that a range of factors could potentially influence the levels of peripheral Cu and CP, such as diet, lifestyle, and the composition of local drinking water, which are confounding variables that could influence assumptions/interpretations of the data, but unlikely in our opinion to explain the variance between research groups in their appraisal of these values. If measures of Cu or CP are significantly influenced by individual differences in genetics, rather than disease state, then the logical conclusion for this is that peripheral Cu or CP measures are not robust biomarkers for AD. We agree that the Australian community represents a diverse and complex genetic community. However, we would expect that this heterogeneity would be a better test of the utility of Cu or CP measures for discriminating disease classification, when compared to cohorts of more homogenous subjects. Most of the AIBL cohort is Caucasian, and of European descent, so claiming that the isolation of Australia is solely responsible for the derivation in Cu or CP values in our study, is unlikely to be sufficient to explain the variance.
Alan Rembacha,c, James D. Doeckeb,c,d, Blaine R. Robertsa, Ashley I. Busha, for the AIBL Research Groupe
aThe Florey Institute of Neuroscience & Mental Health, The University of Melbourne, VIC, Australia
bThe Australian e-Health Research Centre, Herston, QLD, Australia
cCSIRO Preventative Health Flagship, Molecular Science and Engineering, Parkville, VIC, Australia
dCSIRO Mathematics and Information Sciences, Macquarie University, QLD, Australia
ehttp://www.aibl.csiro.au/References
[1] Rembach A, Doecke JD, Roberts BR, Watt AD, Faux NG, Volitakis I, Pertile KK, Rumble RL, Trounson BO, Fowler CJ, Wilson W, Ellis KA, Martins RN, Rowe CC, Villemagne VL, Ames D, Masters CL, Bush AI (2012) Longitudinal Analysis of Serum Copper and Ceruloplasmin in Alzheimer's Disease. J Alzheimers Dis.
[2] Bento I, Peixoto C, Zaitsev VN, Lindley PF (2007) Ceruloplasmin revisited: structural and functional roles of various metal cation-binding sites. Acta Crystallogr D Biol Crystallogr 63, 240-248.
[3] Lopez-Avila V, Sharpe O, Robinson WH (2006) Determination of ceruloplasmin in human serum by SEC-ICPMS. Anal Bioanal Chem 386, 180-187.
[4] Barrow L, Tanner MS (1988) Copper distribution among serum proteins in paediatric liver disorders and malignancies. Eur J Clin Invest 18, 555-560.
[5] Walshe JM (2003) Wilson's disease: the importance of measuring serum caeruloplasmin non-immunologically. Ann Clin Biochem 40, 115-121.
[6] Twomey PJ, Wierzbicki AS, Reynolds TM, Viljoen A (2009) The copper/caeruloplasmin ratio in routine clinical practice in different laboratories. J Clin Pathol 62, 60-63.
Response to Rembach et al.
We thank the Editor who welcomed this debate in the Journal of Alzheimer’s Disease. We really appreciate the reply from Rembach and colleagues; however, these authors have still not clarified the origin of the positive data on non-Cp Cu reported in Table 2 of Reimbach et al. [1]. Specifically, applying their equation #2 (that is actually the same of Walshe [2]), based on the 6 moles of copper for mole of Cp stoichiometry to the data of total Cu and Cp for healthy controls at baseline reported in Table 2 by Rembach et al. [1], the value of non-Cp Cu is:
Non-Cp Cu = total Cu – [Cp-Cu], and in detail:
Cp-Cu (micromolar) = Cp (micromolar) *6 moles of copper/mole of Cp
=2.40*6= 14.4 micromolar of copper bound to Cp, then
Non-CP Cu = 14.32-14.40 = -0.08 micromolar.This value is very similar to the non-Cp Cu = -0.05 micromolar reported by Reimbach et al. [1] in Table 2; the difference in the exact value can be due to decimal approximation derived by the calculation of the difference of the means of Cu and Cp instead of calculating the means of their differences as we did.
Applying the stoichiometry of 6.23, the Cp-Cu is:
2.40*6.23= 14.95 micromolar, then
Non-CP Cu = 14.32-14.95 = -0.63 micromolarFinally, applying the stoichiometry of 7.1 (as reported for equation #1 of [1], i.e., considering 7.1 moles of copper/mole of ceruloplasmin), the non-Cp Cu is:
2.40*7.1= 17.4 micromolar, and
Non-CP Cu = 14.32-17.4 = -3.08 micromolarWith any of the stoichiometry Cu-Cp proposed (6, 6.23, 7.1) by the authors, it is possible to achieve the value of 1.76 micromolar for healthy controls at baseline reported in Table 2 [1]. Also considering decimal approximation, the value cannot be derived by the data for Cu and Cp reported in Table 2 applying the equations provided by Reimbach et al. [1]. In fact, 1.76 micromolar is about 200-300% higher than -0.63 micromolar, for example. Rembach and colleagues should clarify the exact calculation they used to obtain 1.76 micromolar starting from Cu = 14.32 micromolar and Cp = 2.40 micromolar. In other words, the positive data reported in Table 2 cannot be obtained applying any of the stoichiometry (7.1 versus 6) for Cu and Cp assumed by the these authors [1], different from what they state in many passages of their answer. Unfortunately, this prevents any possible discussion about the consistency of non-CP Cu in the AIBL study. Also considering the negative values for non-Cp Cu, all discussions are precluded. On this basis, we conclude that we agree with Reimbach et al. [1] concerning their conclusion about total copper in AD and controls. However, their data about non-CP Cu do not allow them to drawn any conclusion about non-Cp Cu, either in terms of increasing, decreasing, or stable levels of non-Cp Cu in AD compared to healthy controls, thus about the ‘robustness’ of non-Cp Cu as a marker for AD. Conversely, the same authors proposed a method to measure labile Cu in the brain [3] which appears superior to the calculation. We also proposed a new method to measure non-Cp Cu in serum [4] and these two can hopefully overcome the non-CP Cu calculation, as Reimbach et al. [1] also agreed, to finally obtain hard data of non-Cp Cu in AD.
Moreover, the fact that Cu or Cp can be influenced by individual differences in genetics, rather than disease state, does not logically lead to the conclusion that peripheral Cu or Cp measures are not robust biomarkers for AD, as the Reimbach et al. stated in their Response.
In fact, recent investigations into complex diseases, such as AD, proposed that multiple and independent pathogenic pathways can lead to the same pathologic condition [5], so multiple factors may account for diverse % of the disease risk in populations with diverse ethnicity or living in diverse environments. For example, our data, also considering age and gender as confounders [4, 6-12], demonstrated that in the Italian population, a Cu dysfunction occurred in about 60% of patients with AD. This is not in contrast with Australian AD patients, who can have a lower percentage of Cu-related phenotype. In Australian AD patients, diverse factors can account for their disease risk.
Hoping to provide the readers with useful information to evaluate the theoretical as well as the practical details and facets of this debate, we recommend them to read all the original articles reported in this correspondence, with particular emphasis on the Walshe [2] and Twomey et al. [13] articles to make their own opinion.
References
[1] Rembach A, Doecke JD, Roberts BR, Watt AD, Faux NG, Volitakis I, Pertile KK, Rumble RL, Trounson BO, Fowler CJ, Wilson W, Ellis KA, Martins RN, Rowe CC, Villemagne VL, Ames D, Masters CL, Bush AI (2013) Longitudinal analysis of serum copper and ceruloplasmin in Alzheimer's disease. J Alzheimers Dis 34, 171-182.
[2] Walshe JM (2003) Wilson's disease: the importance of measuring serum caeruloplasmin non-immunologically. Ann Clin Biochem 40, 115-121.
[3] James SA, Volitakis I, Adlard PA, Duce JA, Masters CL, Cherny RA, Bush AI (2012) Elevated labile Cu is associated with oxidative pathology in Alzheimer disease. Free Radic Biol Med 52, 298-302.
[4] Colabufo N, Squitti R (2012) Patent: Method and kit for determination of free copper in serum. European Patent Office (EPO) (RO/EP), Patent number: PCT-SAFE Version 3.51.056.232 MT/FOP 20121001/0.20.5.19
[5] von Bernhardi R, Eugenín J (2012) Alzheimer's disease: redox dysregulation as a common denominator for diverse pathogenic mechanisms. Antioxid Redox Signal 16, 974-1031.
[6] Salustri C, Squitti R, Zappasodi F, Ventriglia M, Bevacqua MG, Fontana M, Tecchio F (2010) Oxidative stress and brain glutamate-mediated excitability in depressed patients. J Affect Disord 127, 321-325.
[7] Squitti R, Barbati G, Rossi L, Ventriglia M, Dal Forno G, Cesaretti S, Moffa F, Caridi I, Cassetta E, Pasqualetti P, Calabrese L, Lupoi D, Rossini PM (2006) Excess of nonceruloplasmin serum copper in AD correlates with MMSE, CSF [beta]-amyloid, and h-tau. Neurology 67, 76-82.
[8] Squitti R, Bressi F, Pasqualetti P, Bonomini C, Ghidoni R, Binetti G, Cassetta E, Moffa F, Ventriglia M, Vernieri F, Rossini PM (2009) Longitudinal prognostic value of serum "free" copper in patients with Alzheimer disease. Neurology 72, 50-55.
[9] Squitti R, Ghidoni R, Scrascia F, Benussi L, Panetta V, Pasqualetti P, Moffa F, Bernardini S, Ventriglia M, Binetti G, Rossini PM (2011) Free copper distinguishes mild cognitive impairment subjects from healthy elderly individuals. J Alzheimers Dis 23, 239-248.
[10] Squitti R, Lupoi D, Pasqualetti P, Dal Forno G, Vernieri F, Chiovenda P, Rossi L, Cortesi M, Cassetta E, Rossini PM (2002) Elevation of serum copper levels in Alzheimer's disease. Neurology 59, 1153-1161.
[11] Squitti R, Pasqualetti P, Cassetta E, Dal Forno G, Cesaretti S, Pedace F, Finazzi-Agro A, Rossini PM (2003) Elevation of serum copper levels discriminates Alzheimer's disease from vascular dementia. Neurology 60, 2013-2014.
[12] Squitti R, Pasqualetti P, Dal Forno G, Moffa F, Cassetta E, Lupoi D, Vernieri F, Rossi L, Baldassini M, Rossini PM (2005) Excess of serum copper not related to ceruloplasmin in Alzheimer disease. Neurology 64, 1040-1046.
[13] Twomey PJ, Wierzbicki AS, Reynolds TM, Viljoen A (2009) The copper/caeruloplasmin ratio in routine clinical practice in different laboratories. J Clin Pathol 62, 60-63.
December 2012
Recently, numerous lifestyle factors have been described that influence the risk of dementia such as smoking, obesity, and physical exercise, or certain nutrients like selenium [1]. Another factor that has received little attention to so far, although it might be of crucial importance in the modern human environment with its increasing complexity and speed-up of daily events, is stress. Psychological stress occurs when individuals face situational demands that exceed their adaptive capacity.
There are different lines of evidence supporting the importance of the role of stress on the development of dementia. Mechanistically, it has long been known that cortisol receptors in the hippocampus might contribute to forgetting. What is adaptive in acutely stressful situations may become a hazard in long-term stress [2, 3].
Observational studies found an association between stressful periods in life and later incidence of Alzheimer’s disease (AD) (see [1] for further references). Stress induces depression and other indications that are associated with AD. Neurophysiological knowledge from stress reducing practices speaks in favor of the importance of the role of stress on AD. While there are no reliable data, to our knowledge, that specifically document the effect of stress reducing practices on the prevention of cognitive decline, research has shown that (a) hippocampal volume is larger in participants with mindfulness training than in age-matched controls, (b) meditation may be used as a method of reducing the activity of the default mode network, whose structures overlap those implicated in AD, and (c) meta-cognitive awareness, a tool to anticipate stress factors before they become ingrained patterns, is developed through meditation. Furthermore, Zen-meditators show no cognitive decline with aged compared with age-matched control [4].
The study of Hebda-Bauer et al. now shows that the HPA axis is activated during early stages of the neuropathology in 3x-Tg AD-mice indicating an increased vulnerability to stress at the initial stages of the disease [5]. Therefore, approaches to reduce stress might not only address a crucial risk factor for AD, but also teach people how to cope with the disease-associated stress, reduce the incidence of other stress-related diseases, and in such a way increase their quality of life.
In reaction to our current culture of information overload, high speed information processing due to high through-put demands, and the promotion of multi-tasking, the awareness and management of daily stresses can be promoted through simple and cost-effective techniques such as meditation, which might provide a practical preventative tool for AD. For those who are spiritually inclined, if regarded under the umbrella of spirituality [6], it might additionally help people to better adhere to a healthy lifestyle [7, 8] and represent essential components in lifestyle-based prevention programs [1].
Future studies are needed to explore the potentials of stress reduction programs in the primary and secondary prevention of dementia.
Martin Loef, Majella Horan, Harald Walach
European University Viadrina, Institute of Transcultural Health Studies, Frankfurt (Oder), Germany; walach@europa-uni.deReferences:
[1] Walach H, Loef M (2012) Towards primary prevention of Alzheimer’s disease. Am J Alzheimers Dis 1, 1-28.
[2] van Praag HM, de Kloet R, van Os J (2004) Stress, the Brain, and Depression. Cambridge University Press, Cambridge.
[3] Bremner JD, Narayan M, Anderson ER, Staib LH, Miller HL, Charney DS (2000) Hippocampal volume reduction in major depression. Am J Psychiatry 157, 115-117.
[4] Pagnoni G, Cekic M (2007) Age effects on gray matter volume and attentional perfomance in Zen meditation. Neurobiol Aging 28, 1623-1627.
[5] Hebda-Bauer EK, Simmons TA, Sugg A, Ural E, Stewart JA, Beals JL, Wei Q, Watson SJ, Akil H (2013) 3xTg-AD mice exhibit an activated central stress axis during early-stage pathology. J Alzheimers Dis, doi: 10.3233/JAD-2012-121438.
[6] Walach H (2011) Spiritualität: Warum wir die Aufklärung weiterführen müssen. Drachen Verlag, Klein Jasedow.
[7] Powell LH, Shahabi L, Thoresen CE (2003) Religion and spirituality: linkages to physical health. Am Psychologist 58(1), 36.
[8] Boswell G, Kahana E, Dilworth-Anderson P (2006) Spirituality and healthy lifestyle behaviors: stress counter-balancing effects on the well-being of older adults. J Religion Health 45, 587-602.November 2012
Influence of GSK3β Polymorphisms on Psychiatric and Neurological Disorders: Recent Insights
I read with great interest the recent article by Bai et al. [1]. Interestingly, recent data suggests that rs334558 polymorphisms of the GSK-3β gene may influence a number of psychiatric and neurological disorders besides amnestic-type mild cognitive impairment.
For instance, the response to antidepressants varies greatly with rs334558 polymorphism of the GSK-3β gene. The best response to antidepressants in rs334558 C carriers is seen in those who expressed 5-HTTLPR s/s homozygosity [2]. On the other hand, those who display 5-HTTLPR l/ l homozygosity show the best response to antidepressant treatment in rs334558 T/ T carriers. These results have been confirmed by Tsai et al. in a recent study [3]. Similarly, the rs334558 polymorphisms influence the grey matter volume in temporal lobes in individuals with schizophrenia. For example, larger brain volumes in Brodmann area 21 are seen in those patients who carry the C allele [4].
Similarly, mutations at the rs334558 locus of the GSK-3β gene may result in altered brain function resulting in amnestic mild cognitive impairment. Impaired regional activation in the right superior frontal gyrus is seen more commonly in the T allele. Similarly, TT/CT carriers at the rs334558 locus have accentuated rSFG connectivity. Amnestic mild cognitive impairment in turn is a risk factor for developing Alzheimer’s disease. A direct increased risk of late onset Alzheimer’s disease is also seen in those who exhibit the T allele at rs334558 [5]. The -157T/-50T haplotype in particular increases the risk of developing late onset Alzheimer’s disease, especially in the Han Chinese population.
Similarly, the rs334558 polymorphism increases susceptibility to multiple sclerosis. For instance, individuals with the rs334558 GG genotype are almost 1.6 times more likely to develop multiple sclerosis [6]. The rs334558 GG particularly affects the rate of gene transcription and is especially associated with the relapsing remitting subtype of multiple sclerosis.
The above examples clearly illustrate the significant role that rs334558 polymorphisms of the GSK-3β gene play in psychiatric as well as neurological disorders and the need for further studies in this regard.
Shailendra Kapoor, M.D.
Mechanicsville, VA
Tel: 865-607-1014; shailendrakapoor@yahoo.comReferences
[1] Bai F, Shi Y, Yuan Y, Yue C, Zhuang L, Xu X, Liu X, Zhang Z (2012) Association of a GSK-3β polymorphism with brain resting-state function in amnestic-type mild cognitive impairment. J Alzheimers Dis 32, 387-396.
[2] Benedetti F, Dallaspezia S, Lorenzi C, Pirovano A, Radaelli D, Locatelli C, Poletti S, Colombo C, Smeraldi E (2012) Gene-gene interaction of glycogen synthase kinase 3-beta and serotonin transporter on human antidepressant response to sleep deprivation. J Affect Disord 136, 514-519.
[3] Tsai SJ, Liou YJ, Hong CJ, Yu YW, Chen TJ (2008) Glycogen synthase kinase-3beta gene is associated with antidepressant treatment response in Chinese major depressive disorder. Pharmacogenomics J 8, 384-390.
[4] Benedetti F, Poletti S, Radaelli D, Bernasconi A, Cavallaro R, Falini A, Lorenzi C, Pirovano A, Dallaspezia S, Locatelli C, Scotti G, Smeraldi E (2010) Temporal lobe grey matter volume in schizophrenia is associated with a genetic polymorphism influencing glycogen synthase kinase 3-beta activity. Genes Brain Behav 9, 365-371.
[5] Zhang N, Yu JT, Yang Y, Yang J, Zhang W, Tan L (2011) Association analysis of GSK3B and MAPT polymorphisms with Alzheimer's disease in Han Chinese. Brain Res 1391, 147-153.
[6] Galimberti D, Macmurray J, Scalabrini D, Fenoglio C, De Riz M, Comi C, Comings D, Cortini F, Villa C, Serpente M, Cantoni C, Ridolfi E, Fardipoor MH, Leone M, Monaco F, Bresolin N, Scarpini E (2011) GSK3beta genetic variability in patients with multiple sclerosis. Neurosci Lett 497, 46-48.September 2012
Testosterone and DHEA are Directly Involved in Alzheimer’s Disease
This explanation is relevant within an evolutionary context.
I think mammals evolved because of natural selection for dehydroepiandrosterone (DHEA) [1]. This is based on my principal hypothesis that DHEA increases replication and transcription of DNA, that is, DHEA increases gene activation.
Furthermore, I think primates and humans evolved within mammals because of natural selection of testosterone with the maximum effect occurring in humans [2,3].
The positive effect which testosterone promotes is increased androgen receptor formation. Since DHEA utilizes androgen receptors, testosterone increases entrance of DHEA and, therefore, gene activity. This change in gene activity causes differential growth in the brain as well as the body and may be the basis for sex differences. In the evolution of primates/humans, maternal testosterone increases androgen receptors in fetal brains. This increases gene activity and, therefore, bigger brains. This effect in humans, probably, first appeared in Homo erectus, or whatever hominid is now considered the origin of Homo in which male/female size differences were first reduced. The size difference between male and female H. erectus was reduced by an increase in females. The effect was a result of dramatic increase in females of higher testosterone.
The increased hominid, maternal testosterone exaggerated the ongoing primate increase in testosterone which produced a brain large enough to produce competition for DHEA, via androgen receptors, between the body and the brain. As the brain enlarged during this competition, it enlarged at the expense of the body; our brains grew bigger and our bodies became more gracile.
My point is that testosterone and DHEA combine to produce a brain and maintain it. In 1985, I first suggested that low DHEA was involved in Alzheimer’s disease [4]. Subsequently, I decided that testosterone evolved to increase use of DHEA by all tissues, especially the brain. As far as I can determine, the first reports of low DHEA in Alzheimer’s disease appeared in 1987 [5] and then in 1989 [6-8].
The reason women exhibit more Alzheimer’s disease is lower testosterone and DHEA. Since both testosterone and DHEA decline naturally with age, genes with less than robust formation, which are involved with brain function, will malfunction during the natural decline of testosterone and DHEA. Many will develop Alzheimer’s disease in old age, but not all.�Moreover, individuals with vulnerable genes may exhibit the disease early on when testosterone and DHEA first begin to decline significantly. This is “early onset Alzheimer’s disease.”
James Michael Howard
Fayetteville, ArkansasReferences
[1] Howard J (2001) Hormones in mammalian evolution. Riv Biol 94, 177-183.
[2] Howard JM (2002) "Mitochondrial Eve," "Y Chromosome Adam," testosterone, and human evolution. Riv Biol 95, 319-325.
[3] Howard J (2001) Androgens in human evolution. A new explanation of human evoluation. Riv Biol 94, 345-362.
[4] Howard JM (1985) A theory of the control of the ontogeny and phylogeny of Homo sapiens by the interaction of dehydroepiandrosterone and the amygdala. United States Copyright Office, Registration Number: TXu00022058.
[5] Bologa L, Sharma J, Roberts E (1987) Dehydroepiandrosterone and its sulfated derivative reduce neuronal death and enhance astrocytic differentiation in brain cell cultures. J Neurosci Res 17, 225-234.
[6] Sunderland T, Merril CR, Harrington MG, Lawlor BA, Molchan SE, Martinez R, Murphy DL (1989) Reduced plasma dehydroepiandrosterone concentrations in Alzheimer's disease. Lancet 2, 570.
[7] Mohan PF (1989) Dehydroepiandrosterone and Alzheimer's disease. Lancet 2, 1048-1049.
[8] Svec F, Lopez A (1989) Antiglucocorticoid actions of dehydroepiandrosterone and low concentrations in Alzheimer's disease. Lancet 2, 1335-1336.
April 2012
Aluminum is a Neurotoxin in its Own Right
I have read Dr Brenner's interesting hypothesis that aluminum may facilitate pancreas-derived amyloid-β (Aβ) transport across the blood-brain barrier. This deserves to be examined and tested by epidemiological studies to determine the extent to which the pancreas may contribute to the brain’s Aβ burden in addition to that produced in situ by astrocytes and neurons [1].
I note that Dr Brenner has yet to accept that aluminum is a neurotoxin. There are occasional reports in the literature that could give this impression. However, the apparent absence of aluminum toxicity in aluminum-exposed cells or animals usually indicates that the duration of exposure has been too brief. Alternatively, the aluminum dose could have been too high. An excess of aluminum causes aggregation of polynuclear aluminum species and formation of precipitates that severely reduce the actual amount of aluminum delivered to the cells. Also, the criterion for assessing neurotoxicity needs to be appropriate. Some toxins such as 1-methyl-4-phenylpyridinium ion (MPP) act by killing cells which results in leakage of lactic acid dehydrogenase into the cell medium [2]. Aluminum is different.
Aluminum salts exert their neurotoxicity by crippling cell function instead of killing cells outright. Aluminum preferentially deposits in pyramidal cells of brain regions that are also vulnerable to damage in AD. Aluminum neurotoxicity in individuals with normal kidney function depends on slow accumulation over time in cortical and hippocampal cells where aluminum causes damage by (i) competing with essential metals in key regulatory reactions, (ii) producing oxidative stress, and (iii) disrupting cellular metabolism in general. Such disruption can interfere with neuronal calcium signaling and neurotransmission as described in my recent review article [3].
High stage aluminum accumulation in neurons blocks microtubule formation, resulting in dendritic dieback and loss of synapse density [4]. Aluminum participates in the formation and growth of neurofibrillary tangles in AD brains [5]. Also, an aluminum-inducible animal model for AD develops cognitive deterioration in old age, with AD-relevant neuropathology [4], after chronically ingesting aluminum in equivalent amounts to those ingested by Americans from processed food, alum-treated drinking water, and other sources of aluminum additives [6].
Aluminum neurotoxicity has been demonstrated at all levels, from sub-nanomolar levels of produced in a carefully defined system [7] to human populations where aluminum neurotoxicity has caused and/or contributed to various types of dementia [8-11]. For example, 19/20 dialysis patients (aged 32-64 years old) died after developing dialysis dementia in the period 3 months to 4 years after Chicago altered its method of water purification in June 1972. This change involved higher aluminum levels (peaking between 300 and 400 μg/L) in the drinking water [8].
Dr. Brenner refers to Aβ neurotoxicity. A substantial body of evidence attests to Aβ being a by-product of aluminum neurotoxicity (reviewed in [12]). On balance, there seems to be far more evidence for in vivo aluminum neurotoxicity than for in vivo Aβ neurotoxicity.
J.R. Walton, PhD
UNSW Faculty of Medicine, University of New South Wales, St George Hospital Campus, Sydney, NSW, AustraliaReferences
[1] Busciglio J, Gabuzda DH, Matsudaira P, Yankner BA (1993) Generation of beta-amyloid in the secretory pathway in neuronal and nonneuronal cells. Proc Nat Acad Sci U S A 90, 2092-2096.
[2] Shimma N, Akiyama N, Umezawa M, Okuma Y, Nomura Y, Saito T, Horie S, Murayama T (2003) Possible role of interleukin-6 in PC12 cell death induced by MPP+ and tetrahydroisoquinoline. J Pharmacol Sci 93, 471-477.
[3] Walton JR (2012) Aluminum disruption of calcium homeostasis and signal transduction resembles change that occurs in aging and Alzheimer's disease. J Alzheimers Dis 29, 255-273.
[4] Walton JR (2009) Brain lesions comprised of aluminum-rich cells that lack microtubules may be associated with the cognitive deficit of Alzheimer’s disease. Neurotoxicology 30, 1059-1069.
[5] Walton JR (2010) Evidence for participation of aluminum in neurofibrillary tangle formation and growth in Alzheimer's disease. J Alzheimers Dis 22, 65-72.
[6] Walton JR (2009) Functional impairment in aged rats chronically exposed to human range dietary aluminum equivalents. Neurotoxicology 30, 182-193.
[7] Miller JL, Hubbard CM, Litman BJ, Macdonald TL (1989) Inhibition of transducin activation and guanosine triphosphatase activity by aluminum ion. J Biol Chem 264, 243-250.
[8] Dunea G, Mahurkar SD, Mamdani B, Smith EC (1978) Role of aluminum in dialysis dementia. Ann Intern Med 88, 502-504.
[9] Alfrey AC, LeGendre GR, Kaehny WD (1976) The dialysis encephalopathy syndrome, possible aluminum intoxication. N Engl J Med 294, 184-188.
[10] Yasui M, Yase Y, Ota K, Garruto RM (1991) Aluminum deposition in the central nervous system of patients with amyotrophic lateral sclerosis from the Kii Peninsula of Japan. Neurotoxicology 12, 615-620.
[11] Kobayashi S. Hirota N, Saitio K (1987) Aluminum accumulation in tangle-bearing neurons of Alzheimer’s disease with Balint’s syndrome in a long-term aluminum refiner. Acta Neuropathol 74, 47-52.
[12] Walton JR (2012) Evidence that ingested aluminum additives contained in processed foods and alum-treated drinking water are a major risk factor for Alzheimer's disease. Curr Inorg Chem 2, 19-39.
Response to article: Walton JR (2012) Aluminum disruption of calcium homeostasis and signal transduction resembles change that occurs in aging and Alzheimer’s disease. J Alzheimers Dis 29, 255, 273.
I read about the effects of aluminum on brain with features of aging and calcium signaling with interest [1]. The effects of aluminum on the brain in the pathogenesis of Alzheimer’s disease (AD) may play out at the blood brain barrier. Aluminum enhances the permeability of the blood-brain barrier to lipophilic substances [2] and the central part of the amyloid-β peptide (Aβ), the alpha helical antigenic folding domain of the Aβ folding peptide loop is lipophilic [3]. Studies have indicated that some of the Aβ present in AD patients was from peripheral blood, and endogenous bloodborne Aβ has been found to cross the blood-brain barrier by a non-saturable mechanism [4].
Aβ and hyperphosphorylated tau deposits have been found in the pancreas of patients with type 2 diabetes [5]. Aβ may escape into the circulation from the pancreas, especially in patients with type 2 diabetes, and cross the blood-brain barrier, especially if it has been primed by aluminum exposure, which increases its permeability to lipophilic substances such as Aβ. The increased brain exposure to Aβ may in turn cause increased likelihood of developing AD in susceptible individuals.
Although the effect of aluminum on development of AD remains controversial, certainly increased amounts of Aβ are thought to increase the likelihood of developing AD. If the blood-brain barrier is exposed to aluminum, it may in turn cause increased amounts of Aβ to accumulate in the brain with subsequent neurotoxicity and development of AD. Aluminum is not necessarily toxic in its own right, but may cause increased exposure of the brain to the neurotoxin, Aβ, one of the main components of AD, by permitting it to pass through the blood-brain barrier at an increased rate.
Steven R. Brenner, MD
Affiliated with St. Louis University
Department of Neurology and Psychiatry
St. Louis, MO, USA
Tel: 314-977-6082References
[1] Walton, JR (2012) Aluminum disruption of calcium homeostasis and signal transduction resembles change that occurs in aging and Alzheimer’s disease. J Alzheimers Dis 29, 255-273.
[2] Banks, WA, Kastin AJ (1985) Peptides and the blood-brain barrier: lipophilicity as a predictor of permeability. Brain Res Bull 3, 287-292.
[3] DeMager PP, Penke B, Walter R, Harkany T, Hartignny W (2002) Pathological folding in Alzheimer’s disease and other conformational disorders. Curr Med Chem 19, 1763-1780.
[4] Maness, LM, Banks WA. Podlinsy MB, Selkow DJ, Kastin AJ (1994) Passage of human Amyloid B-protein 1-40 across the murine blood-brain barrier. Life Science 55, 1643-1650.
[5] Miklossy J, Qing H, Radenovic A, Kis A, Vileno B, Laszlo F, Miller L, Martins RN, Waeber G, Mooser V, Bosman F, Khalili K, Darbinian N, McGeer PL (2010) Beta amyloid and hyperphosphorylated tau deposits in the pancreas in type 2 diabetes. Neurobiol Aging 31, 1503-1515.
February 2012
It is important to clarify, based upon the data presented, this paper’s conclusion that cathepsin B lacks “β-secretase activity” because the ambiguity of that statement could lead some readers to erroneously believe that the data show cathepsin B lacks the wild-type (WT) β-secretase activity that predominates in the common form of sporadic Alzheimer’s disease (AD). In fact, what this paper’s data show is that cathepsin B lacks Swedish mutant (Swe) β-secretase activity found in a very rare form of familial AD, and they say nothing about its WT β-secretase activity, which is the target activity for developing inhibitors to treat most AD patients. That is because the paper determined “β-secretase” activity using the NH2-Arg-GLu-(EDANS)-Glu-Val-Asn-Leu-Asp-Ala-Glyu-Phe-Lys(D-ABCYL)-Arg-COOH substrate, which contains the Swe mutations at the β-secretase cleavage site (Swe residues underlined). That sequence only detects Swe β-secretase activity, and no other substrate containing the WT β-secretase cleavage site was used. As correctly cited in the paper, cathepsin B is known not to cleave substrates containing the Swe β-secretase site but to readily cleave those containing the WT sequence [1,2]. Finding that cathepsin B does not have Swe β-secretase activity is corroborative but not new data, and, thus, the conclusion is a bit misleading. Moreover, reporting that cathepsin B does not cleave a substrate which it is known not to cut says nothing about cathepsin B’s role in cleaving a sequence that it does cut, the WT β-secretase site sequence. In contrast, our cathepsin B gene knockout data confirm previous enzymology data showing that cathepsin B has WT β-secretase activity in an appropriate transgenic mouse model [2,3]. I hope these observations help readers focus on the conclusion that is actually supported by the paper’s data, which is that cathepsin B lacks Swe β-secretase activity.
Greg Hook, Ph.D., JD
American Life Science Pharmaceuticals
San Diego, CA
References[1] Hook VY, Kindy M, Hook G (2008) Inhibitors of cathepsin B improve memory and reduce Abeta in transgenic Alzheimer's Disease mice expressing the wild-type, but not the Swedish mutant, beta -secretase APP site. J Biol Chem 283, 7745-7753.
[2] Hook VY, Kindy M, Reinheckel T, Peters C, Hook G (2009) Genetic cathepsin B deficiency reduces beta-amyloid in transgenic mice expressing human wild-type amyloid precursor protein. Biochem Biophys Res Commun 386, 284-288.
[3] Kindy MS, Yu J, Zhu H, El-Amouri SS, Hook V, Hook GR (2012) Deletion of the cathepsin B gene improves memory deficits in a transgenic Alzheimer’s disease mouse model expressing AβPP containing the wild-type β-secretase site sequence. J Alzheimers Dis, in press.
January 2012
We would like to make you aware of follow-up clinical data from an open-label extension (OLE) study (AVA104617) to the rosiglitazone positron emission tomography (PET) study 49653/461, which was recently published [1]. The complex and technical nature of the PET study and the need to present results in a comprehensive fashion precluded the inclusion of these open-label data in the original manuscript. Therefore we are making the following information available to your readers.
Subjects who completed the 12-month, placebo-controlled, parent study were eligible to enter into this OLE study. All subjects entering the OLE study received an investigational formulation of rosiglitazone (RSG-XR) 4 mg for the first 4 weeks and then 8 mg for the remaining 44 weeks of the study. Study outcomes evaluation visits were conducted at 4 or 8-week intervals. The primary objective of the study was to evaluate the long-term safety and tolerability of RSG-XR. The secondary objective was to measure changes in cognition using the Mini-Mental Status Examiniation (MMSE). This OLE was conducted at 7 of the sites (6 in the US, 1 in Canada) that participated in the PET study.
Thirty-three subjects entered into the OLE and comprise the safety population. The mean age of the subjects who entered the study was 71.9 (9.75 SD), 55% were male, 94% were Caucasian, and 21 (64%) completed the 48 weeks of treatment. Of the 12 subjects who withdrew prematurely, 2 were withdrawn due to serious adverse events (pelvic fracture, fall and convulsion) and 2 were withdrawn due to non-serious adverse events. The remainder of subjects who withdrew prematurely did so mostly for non-specific reasons (n= 4) or a lack of efficacy/disease progression (n=3).
The most common adverse events (reported in > 5% of subjects [n=33]) are listed below:
n (%)
Any adverse event 25 (76)
Edema peripheral 4 (12)
Depression 3 (9)
Fall 3 (9)
Hematoma 2 (6)
Abnormal loss of weight 2 (6)
Vomiting 2 (6)
Agitation 2 (6)
Bursitis 2 (6)There were no fatalities during the study. Clinical laboratory data indicated a mild decline in mean (SD) hemoglobin (n=13, 11.1(4.2) g/L) and hematocrit (n=13, 3.9(1.8) %) consistent with the known effects of rosiglitazone. There were no clinically significant changes noted on ECGs during the conduct of this study.
There were no specific concerns noted regarding cardiovascular safety; rates of events for myocardial ischemia was low (1/33, 3%).
Subjects entered the study with a mean MMSE at baseline of 17.4. During the conduct of this study, there was a mean decline in MMSE scores of 4.5 (4.1 SD) points which is consistent with the natural rate of disease progression [2].
In conclusion, this OLE study enrolled 33 subjects who completed study 49653/461 [1]. The subjects who enrolled in this OLE study were demographically similar to those who enrolled in the parent study. The safety data obtained during this study are consistent with the known side-effect profile of rosiglitazone. The small sample size, non-randomized population and lack of control group preclude any conclusions about the efficacy of rosiglitazone in this population.
Michael Gold1, Barbara Jeter2, Paul M. Mathews3
1Formerly of GlaxoSmithKline, currently of Allon Therapeutics, Vancouver, British Columbia
2GlaxoSmithKline, Neurosciences Medicine Development Centre, Research Triangle Park, NC, USA
3GlaxoSmithKline, Clinical Imaging Centre, Hammersmith Hospital, London, UK and Department of Clinical Neuroscience, Imperial College, London, UK
References
[1] Tzimopoulou S, Cunningham VJ, Nichols TE, Searle G, Bird NP, Mistry P, Dixon IJ, Hallett WA, Whitcher B, Brown AP, Zvartau-Hind M, Lotay N, Lai RY, Castiglia M, Jeter B, Matthews JC, Chen K, Bandy D, Reiman EM, Gold M, Rabiner EA, Matthews PM (2010) A multi-center randomized proof-of-concept clinical trial applying [18F]FDG-PET for evaluation of metabolic therapy with rosiglitazone XR in mild to moderate Alzheimer's disease. J Alzheimers Dis 22, 1241-1256.[2] Doody R, Massman P, Dunn J (2011) A method for estimating progression rates in Alzheimer disease. Arch Neurol 58, 449-454.
December 2011
Response to “Possible alteration of amyloid precursor protein metabolism or trafficking in a 17 β-hydroxysteroid dehydrogenase X deficient patient”
We thank Dr. Xue-Ying He and collaborators for their interesting observations, which add important information to our work.
Regarding the nomenclature of the disease, we agree that “17β-hydroxysteroid dehydrogenase X deficiency”, or “HSD10 deficiency” as an alternative name, is the specific disorder of this patient. Although the type of 17β-hydroxysteroid dehydrogenase is not detailed in the title, “HSD10 deficiency” as the specific disease of the patient is largely stated all over the text. In any case, we agree that it should have been useful to clarify it in the title.
On the other hand, we fully agree with Dr. He and collaborators about the necessity of analyzing other varieties of amyloid-β peptides in the cerebrospinal fluid (CSF) and to confirm the results by other more complex procedures. We are grateful indeed for these suggestions. Unfortunately the CSF volume from this patient that still remains in our laboratory is probably not enough to carry out these complementary experiments. Nevertheless, it would be extremely useful to collect more CSF in future patients in order to validate, and make more complete, the reported results.
Carlos Ortez1,2, Cristina Villar1,2, Carmen Fons1,2, Sofía T. Duarte1,3, Ana Pérez1,2, Judith García-Villoria2,4, Antonia Ribes2,4, Aida Ormazábal2,5, Mercedes Casado2,5, Jaume Campistol2,5, Maria Antonia Vilaseca2,5, Angels García-Cazorla1,2
Department of 1Neurology and 5Biochemistry, Hospital Sant Joan de Déu, Barcelona, Spain
2CIBER-ER (Biomedical Network Research Centre on Rare Diseases), Instituto de Salud Carlos III, Madrid, Spain
3Neuropaediatric Department, Hospital D. Estefânia, CHLC, EPE and CEDOC, Faculdade de Ciências Médicas da Universidade Nova de Lisboa, Portugal
4Sección de Errores Congénitos del Metabolismo (IBC), Servicio de Bioquímica y Genética Molecular, Hospital Clínic, Barcelona, Spain.Possible Alteration of Amyloid-β Protein Precursor Metabolism or Trafficking in a 17β-Hydroxysteroid Dehydrogenase X Deficiency Patient
We read with great interest the recent report by Ortez et al. [1], “Undetectable levels of CSF amyloid-β (Aβ) peptide in a patient with 17β-hydroxysteroid dehydrogenase deficiency”. The authors claim that Aβ peptide was not detectable in the cerebrospinal fluid (CSF) of a mentally retarded patient. The dramatically reduced levels of amyloid-β peptide in CSF might indicate an alteration of amyloid-β protein precursor metabolism or trafficking in the patient’s brain. To our knowledge, thirteen of fourteen different types of 17β-hydroxy-steroid dehydrogenase have been discovered in human tissues [2]. For example, 17β-hydroxysteroid dehydrogenase III deficiency [3] is a completely different disease from 17β-hydroxysteroid dehydrogenase X deficiency [4]. The disease suffered by this patient should be specifically described as “17β-hydroxysteroid dehydrogenase X deficiency” rather than 17β-hydroxysteroid dehydrogenase deficiency—an all-inclusive term.
A variety of amyloid-β peptides including Aβ1-37, Aβ1-38, Aβ1-39, Aβ1-40, and Aβ1-42 are present in human CSF [5]. However, data presented in this article (see Fig. 1 of Ref. 1) showed only the absence of a 44 kDa protein band in the patient’s CSF. As the authors emphasize, their finding points to a new direction for the study of Aβ metabolism, and it suggests that 17β-hydroxysteroid dehydrogenase X inhibitors might be candidates for Alzheimer’s disease therapy. Therefore, it is important that the absence of Aβ be firmly established. The masses of Aβ peptides lie in the range of 4300-4500 amu, and in several Western blotting procedures they migrate as monomers of apparent masses of about 4 kDa. Santa Cruz Biotechnology, Inc., the source of the antibody, claims that the band around 40 kDa revealed by their antibody is an oligomeric form of the 4 kDa peptide [6]; however, in experimental samples other explanations may account for the presence or absence of the band. We think that before one can accept that 17β-hydroxysteroid dehydrogenase X deficiency alters amyloid-β protein precursor metabolism or trafficking, the experiment must be repeated with other better characterized antibodies in other separation systems. For instance, a more sophisticated experimental procedure, namely quantitative urea-based Aβ-SDS-PAGE/immunoblot, could be employed [5]. We hope this patient will be demonstrated not to be an anecdotal case of the reduction of Aβ peptide levels in CSF. The finding could be confirmed in other HSD10 deficiency patients carrying the same mutation (c.628C>T) [7] or different mutations [8,9] in the HSD17B10 gene.
Xue-Ying He1, David Miller2, Song-Yu Yang1
Departments of 1Neurochemistry and 2Molecular Biology, NYS Institute for Basic research in Developmental Disabilities, Staten Island, NY, USA
Email: songyu.yang@csi.cuny.eduAcknowledgments: This work was supported in part by the NYS Office for People With Developmental Disabilities.
References
[1] Ortez C, Villar C, Fons C, Duarte ST, Perez A, Garcia-Villopia J, Ribes A, Ormazabal A, Casado M, Campistol J, Vilaseca MA, Garcia-Cazorla A (2011) Undetectable levels of CSF amyloid-β peptide in a patient with 17β-hydroxysteroid dehydrogenase deficiency. J Alzheimers Dis 27, 253-257.[2] Moeller G, Adamski J (2009) Integrated view on 17beta-hydroxysteroid dehydrogenase. Mol Cell Endocrinol 301, 7-19.
[3] Mains LM, Vakili B, Lacassie Y, Andersson S, Lindqvist A, Rock JA (2008) 17beta-hydroxysteroid dehydrogenase 3 deficiency in a male pseudoherma- phrodite. Fertil Steril 89, 228.e13-17.
[4] Yang SY, He XY, Miller D (2011) Hydroxysteroid (17beta) dehydrogenase X in human health and disease. Mol Cell Endocrinol 343, 1-6.
[5] Bibl M, Mollenhauer B, Esselmann H, Lewczuk P, Klafki H, Sparbier K, Smironov A, Cepek L, Trenkwalder C, Ruther E, Kornhuber J, Otto M, Wiltfang J (2006) CSF amyloid-β-peptides in Alzheimer’s disease, dementia with Lewy bodies and Parkinson’s disease dementia. Brain 129, 1177-1187.
[6] Liu RT, Zou LB, Fu JY, Lu QJ (2010) Effects of liquiritigenin treatment on the learning and memory deficits induced by amyloid β-peptide (25-35) in rats. Behavioural Brain Res 210, 24-31.
[7] García-Villoria J, Navarro-Sastre A, Fons C, Pérez-Cerdá C, Baldellou A, Fuentes-Castelló MA, González I, Hernández-Gonzalez A, Fernández C, Campistol J, Delpiccolo C, Cortés N, Messeguer A, Briones P, Ribes A (2009) Study of patients and carriers with 2-methyl-3-hydroxybutyryl-CoA dehydrogenase (MHBD) deficiency: difficulties in the diagnosis. Clin Biochem 1-2, 27-33.
[8] Seaver LH, He XY, Abe K, Cowan T, Enns GM. Sweetman L, Lee S, Malik M, Yang SY (2011) A novel mutation in the HSD17B10 gene of a 10-year-old boy with refractory epilepsy, chreoathetosis and learning disability. PLoS ONE 6, 11. e27348.
[9] Yang SY, He XY, Olpin SE, Sutton VR, McMenamin J, Philipp M, Denman RB, Malik M (2009) Mental retardation linked to mutations in the HSD17B10 gene interfering with neurosteroid and isoleucine metabolism. Proc Natl Acad Sci U S A 106, 14820-14824.
Response to Letter to the Editor from Anderson
We greatly appreciate the comment of Dr. George Anderson on our recently published paper in the Journal of Alzheimer’s Disease. Although we were aware of the fact that in Alzheimer’s disease and in major depression the circadian regulation is disturbed, we did not focus in this study on the role of circadian genes and the aryl hydrocarbon receptors in the regulation of indoleamine 2,3-dioxygenase (IDO). However, we were pleased to read Dr. Anderson’s remarks and discussion, and, indeed, it might be worthwhile including circadian aspects in future models of depression and Alzheimer’s disease.
Niki Dobos, Ulrich L. M. Eisel, Paul G. M. Luiten
I read with interest the recent article by Dobos et al. [1] on the role of indoleamine 2,3-dioxygenase (IDO) in depression (MDD), suggestive of overlaps to the role of IDO in Alzheimer’s disease (AD). The kynurenine pathways are an area of extensive current research, given the links to stress, prodromal MDD, emergent seizures, and neurodegeneration [2]. I wondered as to whether the authors had considered a role for the aryl hydrocarbon receptor (AHr) and circadian genes in the regulation of IDO.
Recent data suggests a significant role for the AHr in the induction of IDO in different cell types [3]. The AHr is activated by kynurenine [4], suggesting a possible positive feedback loop whereby IDO, or maybe more likely TDO (tryptophan 2,3-dioxygenase), induced kynurenine would activate the AHr, leading to IDO induction. In both MDD and AD, increased HPA axis activity enhances cortisol induction of TDO in astrocytes and some neurons. The release of kynurenine would then activate microglia AHr, leading to the induction of IDO and quinolinic acid (QA). QA is excitotoxic, increasing neuronal loss and contributing to emergent seizures [2]. QA is increased in some central nervous system regions in stress-induced depression in rodents [5] and in MDD patients [6]. Such a scenario suggests a powerful role for the intercommunication between glia, via the kynurenine pathway products, in the overlap of MDD and AD.
Circadian dysregulation is a relevant factor in both AD and mood disorders [7,8]. Circadian genes have a role in the regulation of the IDO pathways. The circadian gene Period1 is known to interact with, and modulate the activity of, the AHr [9]. TCDD, the classical activator of the AHr, shows dramatic differences between day and night AHr inductions [10]. If indeed the AHr is a significant inducer of IDO in microglia, some of the circadian gene and melatonin links to AD and MDD may be driving significant alterations in glia kynurenine pathway activity, with impacts on neuronal activity and survival.
There are likely many different facets and etiologies to MDD. Somatization significantly overlaps with MDD, and has been shown recently by Michael Maes and colleagues to be differentiated from MDD on the basis of the patterning of kynurenine pathway products [11]. Specifically somatization shows increased kynurenine and relatively decreased kynurenic acid in comparison to MDD. This could suggest that somatization is a confounding factor in conceptualizations of overlaps in the biochemical underpinnings of MDD and AD.
George Anderson
CRC, 57 Laurel Street, Scotland G11 7QT
anderson.george@rocketmail.comReferences:
[1] Dobos N, de Vries FF, Kema IP, Patas K, OPrins M, Nijholt IM, Dierckx RA, Korf J, den Boer JA, Luiten PG, Eisel UL (2012) The role of indoleamine 2,3-dioxygenase in a mouse model of neuroinflammation-induced depression. J Alzheimers Dis, doi: 10.3233/JAD-2011-111097[2] Anderson G, Ojalla JO (2010) Alzheimer’s and seizures: interleukin-18, indoleamine 2,3-dioxygenase and quinolinic acid. Int J Trytophan Res 3, 169-173.
[3] Nguyen NT, Kimura A, Nakahama T, Chinen I, Masuda K, Nohara K, Fujii-Kuriyama Y, Kishimoto T (2010) Aryl hydrocarbon receptor negatively regulates dendritic cell immunogenicity via a kynurenine-dependent mechanism. Proc Natl Acad Sci U S A 107, 19961-19966.
[4] Opitz CA, Litzenburger UM, Sahm F, Ott M, Tritschler I, Trump S, Schumacher T, Jestaedt L, Schrenk D, Weller M, Jugold M, Guillemin GJ, Miller CL, Lutz C, Radlwimmer B, Lehmann I, von Deimling A, Wick W, Platten M (2011) An endogenous tumour-promoting ligand of the human aryl hydrocarbon receptor. Nature 478, 197-203.
[5] Laugeray A, Launay JM, Callebert J, Surget A, Belzung C, Barone PR (2010) Peripheral and cerebral metabolic abnormalities of the tryptophan- kynurenine pathway in a murine model of major depression. Behav Brain Res 210, 84-91.
[6] Steiner J, Walter M, Gos T, Guillemin GJ, Bernstein HG, Sarnyai Z, Mawrin C, Brisch R, Bielau H, Meyer zu Schwabedissen L, Bogerts B, Myint AM (2011) Severe depression is associated with increased microglial quinolinic acid in subregions of the anterior cingulated gyrus: Evidence for an immune-modulated glutamatergic neurotransmission? J Neuroinflamm 8, 94.
[7] Cermakian N, Lamont EW, Boudreau P, Boivin DB (2011) Circadian clock gene expression in brain regions of Alzheimer’s disease patients and control subjects. J Biol Rhythms 26, 160-170.
[8] Soria V, Martínez-Amorós E, Escaramís G, Valero J, Pérez-Egea R, García C, Gutiérrez-Zotes A, Puigdemont D, Bayés M, Crespo JM, Martorell L, Vilella E, Labad A, Vallejo J, Pérez V, Menchón JM, Estivill X, Gratacòs M, Urretavizcaya M (2010) Differential association of circadian genes with mood disorders: CRY1 and NPAS2 are associated with unipolar major depression and CLOCK and VIP with bipolar disorder. Neuropsychopharmacology 35, 1279-1289.
[9] Qu X, Metz RP, Porter WW, Cassone VM, Earnest DJ (2009) Disruption of period gene expression alters the inductive effects of dioxin on the AhR signaling pathway in the mouse liver. Toxicol Appl Pharmacol 234, 370-377.
[10] Qu X, Metz RP, Porter WW, Neuendorff N, Earnest BJ, Earnest DJ (2010) The clock genes period 1and period 2 mediate diurnal rhythms in dioxin-induced Cyp1A1 expression in the mouse mammary gland and liver. Toxicol Lett 196, 28-32.
[11] Maes M, Galecki P, Verkerk R, Rief W (2011) Somatization, but not depression, is characterized by disorders in the tryptophan catabolite (TRYCAT) pathway, indicating increased indoleamine 2,3-dioxygenase and lowered kynurenine aminotransferase activity. Neuro Endocrinol Lett 32, 264-273.
November 2011
Response to Letter to the Editor from Savitri Hensman
We thank Ms. Hensman for her comments and for her interest in our paper. We note her concerns that we might have overestimated the true costs of dementia in 15 countries of the European Union.
As made clear in our paper, due to the aggregate nature of the data used, the precision of a cost-of-illness study to estimate the burden of a disease across several countries depends on the quality and availability of comparable data across the countries of interest. It is also worth stressing that our study omitted relevant costs including: formal home care provided by social services or paid privately (e.g., home assistance, home help, meals on wheels, etc.) and pharmaceuticals typically consumed by dementia patients such as antipsychotics, anxiolytics, hypnotics, and antidepressants. These costs were not included as there was insufficient information in the majority of countries to make an informed estimate.
In our paper, we clearly highlight the limitations of the study, chief among them the fact that for a number of components, including primary and outpatient care visits, as well as hours of informal care, resource use was derived from published studies following cohorts of diagnosed dementia patients rather than from cases identified using population-based studies.
The numbers of institutionalized patients with dementia was estimated using country-specific data derived from a variety of sources, mainly published studies assessing the prevalence of dementia in those living in long-term care homes on the basis of a clinically oriented assessment interview. In our study, we made the assumption that all dementia patients living in nursing/residential accommodation were institutionalized because of their dementia. Of course, this may not be true for all dementia cases, some of whom will have developed dementia prior to institutionalization. However, as documented in the published literature, dementia is a very strong predictor of institutionalization. In fact, for dementia patients living at home, the main predictors of institutionalization appear to be severity of disease/impairment, age of carer, and carer’s state of health [1-3].
As correctly pointed out by Ms. Hensman, the hours of informal care were derived from studies using samples of diagnosed dementia patients (which excluded non-diagnosed cases). However, it is important to note that not all diagnosed patients have moderate or severe dementia. Furthermore, informal care is also provided to patients with mild dementia. For example, in the study used to estimate hours of informal care in the UK [4], the mean Global Deterioration Scale amongst patients receiving care in the community was 3.72 (i.e., mild cognitive impairment-early dementia).
Regarding the concerns about how the number of outpatient visits was estimated in the UK: The NHS Information Centre’s Hospital Episode Statistics (HES) states that “... primary diagnosis is not a mandated field in the outpatients dataset, therefore coverage within this field is poor” [5]. In 2006-7 there were 51,939,835 outpatient visits in England as recorded by HES. Of these, no primary diagnosis was recorded in 50,666,371 (97.6%) outpatient visits, which were recorded as “Unknown and unspecified causes of morbidity”. For this reason, the number of outpatient consultations for dementia estimated in our study is higher than those recorded in HES.
In summary, despite the limitations that we fully acknowledge in our paper, we believe our study provides a good indication of the economic burden of dementia in 15 European countries.
Ramon Luengo-Fernandez, DPhil; Jose Leal, DPhil; Alastair M. Gray, PhD
Health Economics Research Centre, Department of Public Health, Old Road Campus, University of Oxford, Oxford, UKReferences:
[1] Hope T, Keene J, Gedling K, Fairburn CG, Jacoby R (1998) Predictors of institutionalization for people with dementia living at home with a carer. Int J Geriat Psychiatry 13, 682-690.[2] Agüero-Torres H, von Strauss E, Viitanen M, Winblad B, Fratiglioni L (2001) Institutionalization in the elderly: The role of chronic diseases and dementia. Cross-sectional and longitudinal data from a population-based study. J Clin Epidemiol 54, 795-801.
[3] Hébert R, Dubois MF, Wolfson C, Chambers L, Cohen C (2011) Factors associated with long-term institutionalization of older people with dementia: data from the Canadian Study of Health and Aging. J Gerontol A Biol Sci Med Sci 56, M693-M699.
[4] Schneider J, Hallam A, Murray J, Foley B, Atkin L, Banerjee S, Islam MK, Mann A (2002) Formal and informal care for people with dementia: factors associated with service receipt. Aging Ment Health 6, 255-265.
[5] The NHS Information Centre. Hospital Episode Statistics for England. Outpatient statistics, 2006-07. http://www.hesonline.nhs.uk, Accessed 22 November 2011
Response to article: Luengo-Fernandez R, Leal J, Gray AM (2011) Cost of dementia in the pre-enlargement countries of the European union. J Alzheimers Dis. 27, 187-196.
There has been extensive media coverage recently of the findings of Luengo-Fernandez et al. (2011). Dementia is indeed a costly condition. But, from examining the Supplementary Data (http://www.j-alz.com/issues/27/luengo_supplement.pdf), is it possible that the cost has been over-estimated?
Firstly, was comorbidity and impairment not caused by dementia fully accounted for in estimating social care costs, given that dementia patients often have other conditions requiring care? If, say, a 90-year-old with osteoarthritis, heart failure, and impaired vision would have been able to cope at home with £300 worth of care per week, but because she also had dementia needed to be in a residential home at a cost of £800 per week, would the cost of dementia be calculated as £500 rather than the full £800?
Secondly, with regard to the cost of informal care, when ‘The time spent by relatives and friends providing unpaid care for dementia sufferers was obtained from country-specific studies evaluating the informal care patterns of dementia patients... The average hours of informal care given to each dementia patient was then multiplied by the number of people with dementia living in the community and annualized’, was sufficient account taken of the fact that such studies focus on those receiving care for dementia, while many (especially with mild dementia) do not receive informal or formal care and may not even be diagnosed?
Thirdly, with regard to outpatient visits, did the methodology used result in an excessive figure? In the team’s UK-based study ‘Dementia 2010: the economic burden of dementia and associated research funding in the United Kingdom’ (http://www.dementia2010.org/reports/Dementia2010Full.pdf), it was estimated that in 2006 there were 489,766 outpatient consultations for dementia, but this appears many times greater than the figure in the NHS Information Centre’s Hospital Episode Statistics for outpatient attendances in England (where the majority of the UK population lives) in 2006-7 (Primary diagnosis, 2006-07, Excel file).
Savitri Hensman
London, UK; savihensman@hotmail.comOctober 2011
Response to: Zhang et al., A new proposal for randomized start design to investigate disease-modifying therapies for Alzheimer’s disease. Clinical Trials 2011 8: 5-14.
Critical for the increasing prevalence of Alzheimer’s disease and mild cognitive impairment are treatments that modify disease progression rather than providing only symptomatic benefit.
Clinical studies commonly utilize a randomized controlled design, where half, of less than half, of the participants receive a placebo for the study duration. This unfortunately denies treatment to many participants, raising ethical concerns and compromising participation [1]. An alternative is the randomized start design (RSD), where participants are randomized to treatment or placebo for an initial period, after which all participants receive the treatment for the remainder of the study. In addition to increasing participation and compliance, Zhang et al. [2] recently hypothesized that RSD has the unique potential to identify disease modifying (DM) effects versus symptomatic effects since the delayed-start group, once switched to treatment, should display a response equivalent to that of the initial treatment group if the treatment addressed only symptomatic effects. However, should the treatment exert DM, the delayed-start group would not be able to catch up to the initial treatment group due to continued disease progression while on placebo. They present a compelling hypothetical description of these phenomena, and data to support or refute this hypothesis is wanting.
In this regard, during our studies of a nutriceutical formulation (NF; folic acid, vitamin B12, vitamin E, S-adenosyl methionine, N-acetyl cysteine, acetyl-L-carnitine) on cognition and mood in Alzheimer’s disease, we included a RSD study of adults with no known or suspected dementia [3-5]. Since inclusion criteria required absence of any known or suspected cognitive impairment, no relevant DM was encompassed within this study. If the hypotheses of Zhang et al. are correct, the delayed-start group should have attained a level of performance equivalent to that of the initial treatment group. Retrospective examination of our findings as presented herein indicate that this indeed was the case, and therefore provide evidence that supports the use of RSD to detect DM versus symptomatic efficacy.
In our study, 93 participants (both genders, 18-86 years of age) were recruited from community-dwelling individuals. Participants were informed of the trial design during initial presentations, which included randomization to treatment or placebo for the initial 3 months (referred to herein as the “Placebo Phase,” or Period 1, in accord with Zhang et al.), after which code would be revealed and all participants would receive treatment for the remainder of the study (Delayed-start Phase/Period 2). As suggested by Zhang et al., the knowledge that all participants would ultimately receive treatment greatly increased participation. At baseline and subsequent visits, participants completed the Trail-making test (parts A and B), which detects neuromuscular coordination difficulties and the ability to follow simple instructions (part A) and executive function (part B) [6-8]. Scores on A were subtracted from B to isolate effects on executive function. Group performance was statistically compared using an unpaired 1-tailed Student’s t test. In addition, each participant’s baseline score was subtracted from scores at subsequent intervals, and paired t distributions were calculated for each test interval vs. baseline, as well as for the treatment group versus delayed-start group (defined as “delta values” according to Zhang et al.).
The treatment group statistically improved during the placebo phase (i.e., the first 3 months; (p<0.04 versus baseline), while the delayed-start group did not (p<0.24; Fig. 1A); these groups differed statistically at this time (Δ1; p<0.04; Fig. 1A). At the 3-month visit, each participant was informed of prior group assignment. Placebo participants were informed of their switch to treatment (“delayed-start”; Fig. 1A), and after 3 months improved to a level statistically identical to that attained by the treatment group after their first 3 months of treatment (Δ2, p<0.39). The delayed-start group had therefore achieved a level of efficacy equivalent to that of the treatment group within the same respective treatment period.
Additional facets of our study support the RSD. Following the Delayed-start Phase, we withdrew treatment from all participants. After a 3 month “Washout” (Period 3), both groups had declined to levels statistically identical to baseline (p<0.20 and 0.47, respectively) and to each other (Δ3; Fig. 1A). Following resumption of treatment (Resume Phase/Period 4), both groups displayed statistically identical improvement (Δ4; Fig. 1A). These latter findings further indicate that the treatment and delayed-start groups had achieved and maintained statistical identity following the Delayed-start Period.
Zhang et al. point out that if the treatment has no DM effect and only provides symptomatic relief, then the delayed-start group will catch up to the treatment group. By contrast, should the treatment exert DM, the delayed-start group will likely not catch up, and will track differently from the treatment group throughout the remainder of the study. Since we utilized a healthy population, our findings are not intended to address DM but rather are directed entirely to symptomatic effects. The finding that our delayed-start group did indeed catch up to the treatment group, and moreover maintained statistical identity with it through further manipulations (washout and retreatment periods), support the hypothesis of Zhang et al. and, in doing so, provides evidence that RSD has the potential to reveal any DM effect over simple symptomatic effects.
Zhang et al. also address the important concern that code breaking and switching of prior placebo participants to a treatment group, as well as informing the prior treatment group of their status, may induce irregularities in results of an RSD. In this regard, a separate “open-label” cohort (all of which assigned to a treatment group and were aware of it) demonstrated improvement (p<0.04) that was identical to the first 3 months during which the treatment and delayed-start groups received the formulation (Fig. 1B). These findings indicate that the effect of codebreak is minimal and does not invalidate the use of RSD.
This demonstration supports the hypothesis of Zhang et al. that RSD has the capacity to distinguish DM versus symptomatic effects. Coupled with the potential for increased participation, and at least a reduction in the ethical concerns of functionally denying treatment to individuals at risk by maintaining protracted randomization, RSD represents a useful approach for testing novel interventions for AD.
Thomas B. Shea, Ruth Remington
University of Massachusetts • Lowell, Lowell MA 01854References
[1] Speigel R., Berres M, Miserez AR, Monsch AU (2011) For debate: Substituting placebo controls in long-term Alzheimer’s prevention trials. Alzheimers Res Ther 3, 9-11.
[2] Zhang RY, Leon AC, Chuang-Stein C, Romano SJ (2011) A new proposal for randomized start design to investigate disease-modifying therapies for Alzheimer’s disease. Clin Trials 8, 5-14.
[3] Chan A, Lepore A, Kotoya E, Zemianek J, Remington R and Shea TB (2010) Efficacy of a vitamin/nutriceutical formulation on cognitive speed and recall in adults with no known or suspected dementia. J Nutr Health Aging 14, 224-230.
[4] Chan A, Paskavitz J, Remington R, Shea TB (2008) Efficacy of a vitamin/nutriceutical formulation for early-stage Alzheimer’s disease: A one-year open-label pilot study with a 16-month extension. Am J Alz Dis Other Dementias 23, 571-585
[5] Remington R, Chan A, Shea TB (2009) Efficacy of a vitamin/nutriceutical formulation for moderate to late-stage Alzheimer’s disease: A placebo-controlled pilot study. Am J Alz Dis Other Dementias 24, 27-33.
[6] Arbuthnott K and Frank J (2000) Trail making test, part B as a measure of executive control: validation using a set-switching paradigm. J Clin Exp Neuropsychol 22, 518-28.
[7] Crowe SF (1998) The differential contribution of mental tracking, cognitive flexibility, visual search, and motor speed to performance on parts A and B of the Trail Making Test. J Clin Psychol 54, 585-91.
[8] Tombaugh TN (2004) Trail Making Test A and B: normative data stratified by age and education. Arch Clin Neuropsychol 19, 203-14.August 2011
Response to Letter to the Editor from de la Torre
I checked Dr. de la Torre’s papers [1, 2] and found that we do share "advanced aging" in our hypotheses, the well-known greatest risk factor for senile dementia (SD; aka, Alzheimer’s disease). But we also differ significantly in the meaning of "risk factors". While he suggests the importance of morphological and structural changes (deformed microvessels), we emphasize the roles of social, environmental, and lifestyle factors (IQ at young age, social isolation, storytelling, etc.).
In fact, "advanced aging plus risk factors" is street knowledge in the public. It is also shared by many in the medical and clinical community. A search of the keywords "Alzheimer and lifestyle" in PubMed will result in many such papers.
Healthy lifestyle is known as the "key for successful aging" and many people consider SD a "lifestyle disease". Similar views are also found in health books, newspapers, and mass media. So, the model of "advanced aging plus risk factors" is not new, but one going back to common sense, as we emphasized. These issues are further discussed in our recent paper [3].
But the model of advanced aging plus risk factors contrasts sharply with the current dominant hypotheses in the "AD" basic research field, which all assume a single "causal" factor leading to AD. So we together face much more challenging questions:
1. Is it correct to define SD as a "disease" without emphasizing its senile nature?
2. Is there a factor that can contribute to SD more than aging and risk factors in life?
3. What we should logically look for in SD beyond "causal" factors?
4. How to keep the objectivity of science in politically-contentious subjects such as SD?
5. Is SD such a subject?Ming Chen, Ph.D.
[1] de la Torre JC (1997) Hemodynamic consequences of deformed microvessels in the brain in Alzheimer's disease. Ann N Y Acad Sci 826, 75-91.
[2] de la Torre JC (1999) Critical threshold cerebral hypoperfusion causes Alzheimer's disease? Acta Neuropathol 98, 1-8.
[3] Chen M, Nguyen, HT, Sawmiller DR (2011) What to look for beyond "pathogenic" factor in senile dementia? Functional deficiency of Ca2+ signaling. J Alzheimers Dis, in press.Response to Article: Chen M, Maleski JJ, Sawmiller DR (2011) Scientific truth or false hope? Understanding Alzheimer's disease from an aging perspective. J Alzheimers Dis 24, 3-10.
I read with interest a recent article by Chen et al. [1] in the Journal of Alzheimer’s Disease (JAD) where the authors review various concepts relating to the possible cause of Alzheimer’s disease (AD). In that paper, Dr. Chen states: “Thus, put together we propose that advanced aging plus risk factors best explain most SD (senile dementia) cases (4)”. That reference “(4)” cites Dr. Chen’s previous paper from Frontiers in Bioscience published in 2001. In that Frontiers article, Dr. Chen writes: “Accordingly, we have further deduced that advanced aging intensified by risk factors most likely underlie late-onset sporadic AD (16, 17)” [2]. The references 16 and 17 provided by Dr. Chen in the Frontiers article refer to two papers previously published in JAD, June 2000, where he briefly affirms: “Accordingly, we proposed a third model, that is, risk factors under the condition of advanced aging can play a primary role in late onset sporadic AD” [3]. In the same paper, Dr. Chen asserts how he arrived at the aging-risk factor concept: “Indeed, it was a surprise to ourselves as well when it first came as an inevitable outcome of our analytic reasoning” [3].
While I am pleased that Dr. Chen finds the concept of aging + risk factors a viable hypothesis to explain the primary cause of sporadic AD, I would like to point out to him that we constructed this concept and published in previous papers to his and in many conference lectures beginning in 1997, when we showed how aging + AD risk factors were associated with the development of AD [4]. This concept was based on extensive experimental and clinical observations from my laboratory as an extension of our vascular hypothesis of AD [5]. The most thorough of those publications discussing AD causality appeared in Acta Neuropathologica in July 1999 [6], (fully a year prior to Dr. Chen’s article in JAD in June 2000), where I reviewed in a lengthy paper the reasoning and the neurodegenerative pathways related to our proposal that advanced aging + AD risk factors are the likely primary trigger leading to cerebral hypoperfusion, neurodegenerative changes and eventual onset of AD [6]. The Acta paper in 1999 was followed by a number of additional papers published in 2000 (also prior to the article by Dr. Chen in JAD in June 2000), extending our thinking and observational evidence on the pathogenesis of AD (see ref [7]). I have not seen any citations to any of our papers on the topic that Dr. Chen claims as his ‘concept’ although I welcome him to the club that considers that AD can be prevented or slowed down by detecting and controlling its major risk factors [8].
J.C. de la Torre, MD, PhD
Professor of Psychology (Adjunct)
University of Texas, Austin
jcdelatorre@comcast.netReferences
[1] Chen M, Maleski JJ, Sawmiller DR (2011) Scientific truth or false hope? Understanding Alzheimer's disease from an aging perspective. J Alzheimers Dis 24, 3-10.
[2] Chen M, Fernandez HL (2001) Alzheimer’s disease revisited 25 years later: Is it a “disease” or senile condition? Front Biosci 6, e30-e40.
[3] Chen M, Fernandez HL (2000) How Important are risk factors in Alzheimer's disease? J Alzheimers Dis 2, 119-121.
[4] de la Torre JC (1997) Hemodynamic consequences of deformed microvessels in the brain in Alzheimer's disease. Ann N Y Acad Sci 826, 75-91.
[5] de la Torre JC (2010) The vascular hypothesis of Alzheimer's disease: bench to bedside and beyond. Neurodegener Dis 7, 116-121.
[6] de la Torre JC (1999) Critical threshold cerebral hypoperfusion causes Alzheimer's disease? Acta Neuropathol 98, 1-8.
[7] de la Torre JC (2000) Critically attained threshold of cerebral hypoperfusion: the CATCH hypothesis of Alzheimer's pathogenesis. Neurobiol Aging 21, 331-342.
[8] de la Torre JC (2010) Vascular risk factor detection and control may prevent Alzheimer's disease. Ageing Res Rev 9, 218-225.May 2011
Response to Letter to the Editor from Masullo et al.
We thank Dr. Bizzarro et al. their observation, which adds important information to our paper. Their study was not included in the first draft references of our manuscript mainly due to the number of samples used (169 cases and 99 controls). The power of the association and GLM tests on EM estimated haplotypes, calculated according to Shaid et al. showed that we were able to achieve a power of 0.99 only with an almost ten-fold a sample size. We agree however with the authors that their study strengthens the overall picture of haplotypes and interactions affecting APOE correlation with Alzheimer's and age-related diseases.
Best regards,
Francesco Lescai, PhD, EDBTWe have read with interest the paper of Lescai et al.. We were quite surprised by the lack of any reference to a previous study of Bizzarro et al., already reporting these results. In a relative large sample of AD cases from Central and Southern Italy Bizzarro et al. observed a significant association of the -219 (rs405509) polymorphism with AD. Similar, an association of the -219/e4 haplotypes with AD was also reported. Therefore, the study of Lescai et al. in a wide sample of AD patients confirmed the role of the -219 polymorphism as risk factor for AD in Italy and that promoter genotypes and APOE haplotypes might have a complex function as AD-associated genetic risk factors. We feel that the consideration and the evaluation of these results put in the complexity of the discussion of this controversial issue would have been beneficial for the completeness of the published paper and of a major interest for a more analytical information to the readers on the state-of-art on this topic.
Carlo Masullo, MD
Davide Seripa, PhD
Alessandra Bizzarro MD, PhDReference
Bizzarro A, Seripa D, Acciarri A, Matera MG, Pilotto A, Tiziano FD, Brahe C, Masullo C. The complex interaction between APOE promoter and AD: an Italian case-control study. Eur J Hum Genet 2009;17:938-945.February 2011
Response to Letter to the Editor from Félix Bermejo-Pareja
We thank Dr. Félix Bermejo-Pareja for his astute points about the implementation of the clock drawing test (CDT). We agree that although the CDT is a relatively quick test, it is the scoring that can be problematic. This might contribute to lower than anticipated acceptability. In this study we found that a combination of the Mini-mental State Examination (MMSE) and the CDT was more accurate (largely as a rule-out test) that either test used alone but we acknolwedge this is at a cost of additional time. Most tests have difficulty with case-finding (rule-in) for mild cognitive impairment and Alzheimer's disease versus either mild cognitive impairment or healthy controls and the Mini-clock is no exception. Further research is needed to find the optimal short test for these two uses.
J. Benito-León1,2,3, A.J. Mitchell4, J. Cacho5, R. García-García6, B. Fernández-Calvo7, JL Vicente-Villardón8
1Department of Neurology, University Hospital “12 de Octubre”, Madrid, Spain; 2Centro de Investigación Biomédica en Red sobre Enfermedades Neurodegenerativas (CIBERNED), Madrid, Spain; 3Faculty of Medicine, Complutense University, Madrid, Spain; 4Department of Liaison Psychiatry (Dr. Mitchell), Leicestershire Partnership Trust and University of Leicester, Leicester, UK; 5Department of Neurology, University Hospital of Salamanca, University of Salamanca, Salamanca, Spain; 6Department of Basic Psychology and Psychobiology, University of Salamanca, Salamanca, Spain; 7Department of Psychology, Federal University of Paraíba, Brazil; 8Department of Statistics, University Hospital of Salamanca, University of Salamanca, Salamanca, Spain
Could a Combination of the Clock Drawing Test and the Mini-Mental Status Examination Be Used to Screen Dementia in a Neurological Setting? Comments with Data from the NEDICES Survey
The interesting paper recently presented in the Journal of Alzheimer’s Disease [1] suggests, in agreement with one recent report [2], a utilization of the clock drawing test (CDT), in combination with the Mini-Mental Status Examination (MMSE), as a screening method for Alzheimer’s disease (AD) and mild cognitive impairment (MCI) in a neurological setting. . This is a relatively new use of the CDT and MMSE, because both tests are traditionally and preferably employed in these disorders in population- and community-based surveys [3]. It is well known that the use of the CDT in dementia screening has limitations, as it has good screening precision only in moderate and severe dementia cases [4] and in populations without illiterates or subjects with low education [5]. As such, a recent systematic review does not recommend CDT for MCI screening [6], and our experience demonstrated these facts. In the second cross-sectional survey of the Neurological Disorders in Central Spain (NEDICES) cohort (an elderly population-based cohort with low level of education) [7], we screened 3,698 participants in the second cross-sectional survey with an adaptation of the Foltein’s MMSE and a functional scale (FAQ of Pfeffer), and nearly 3,000 subjects also completed a brief neurological test battery. This battery included an executive test (Trail Making Test), several fluency and memory tests, and a verbal intelligence test [8]. A CDT was also included. For evaluating the CDT psychometric properties in this survey, a “convenience” sample (randomly selected but with higher representation of the more aged) of the nearly 3,000 CDTs of the participants was analyzed. Three neurologists and one psychologist blindly evaluated 150 CDTs with the Shulman [9] and Cacho [10] scoring systems. The scoring concordance between the four investigators was not as high as the diagnostic accuracy in the dementia diagnoses employed independently of the scoring system. Currently, the old Spanish population has a cultural level similar to other European countries, but the cultural endowment of the 1997 elderly cohort survey had more than 10% illiterates—complete or functional—and more than 40% who were only able to read and write. With the data of this preliminary study, we decided to not analyze the CDT scores of the participants in the cohort and the work was unpublished. With this experience, however, it is not possible to recommend the use of the CDT in a population with low cultural levels, such as that presented in this paper (the majority of the people were only able to read and write) [5]. It is noteworthy that the completion of the CDT is short (nearly three minutes) but that the interpretation requires time (if it is not done with an elemental scoring system) and experts. Although the authors of this paper certainly meet the expert criteria, most physicians do not have adequate experience.
Furthermore, the data in this study does not demonstrate that the use of the combination of the two tests for MCI and AD screening increases the sensitivity and specificity of this screening in a neurological setting, because these two measures do not increase the screening capacity of these two tests in a statistically significant way.
In summary, this study is interesting and well done, but I think that it does not modify the knowledge that the CDT and MMSE are adequate instruments for dementia screening in population-based and community settings. It is not clear that the combination of both tests increases the efficacy of MCI and AD screening in a neurological setting. As the authors recognize, more studies are needed to demonstrate this efficacy.
Félix Bermejo-Pareja, MD, PhD
Head of Neurology Department. University Hospital “12 de Octubre”. Madrid. Spain
Centro de Investigación Biomédica en Red sobre Enfermedades Neurodegenerativas (CIBERNED), Spain
References
[1] Cacho J, Benito-León J, García-García R, Fernández-Calvo B, Vicente-Villardón JL,Mitchell AJ (2010) Does the combination of the MMSE and Clock Drawing Test (Mini-clock) improve the detection of mild Alzheimer's disease and mild cognitive impairment? J Alzheimers Dis 22, 889-96.
[2] Aprahamian I, Martinelli JE, Neri AL, Yassuda MS (2010) The accuracy of the Clock Drawing Test compared to that of standard screening tests for Alzheimer’s disease: results from a study of Brazilian elderly with heterogeneous educational backgrounds. Int Psychogeriatr 22, 64-71
[3] Strauss E, Sherman EMS, Spreen O, eds (2006) A Compendium of Neuropsychological Tests. Third Edit. Oxford University Press. Oxford.
[4] Nishiwaki1 Y, Breeze E, Smeeth L, Bulpitt CJ, Peters R, Fletcher AE (2004) Validity of the Clock-Drawing Test as a screening tool for cognitive impairment in the elderly. Am J Epidemiol 160,797–807
[5] Ainslie NK Murden RA (1993) Effect of education on the clock drawing dementia screen in non demented elderly patients J Amer Geriatr Soc 41, 249-252
[6] Ehreke L, Luppa M,¨KonigHH, Riedel-Heller SG (2010) Is the Clock Drawing Test a screening tool for the diagnosis of mild cognitive impairment? A systematic review. Int Psychogeriatr 22, 56-63.
[7] Morales JM, Bermejo FP, Benito-Leon J, Rivera-Navarro J, Trincado R, Gabriel SR, Vega S; NEDICES Study Group (2004) Methods and demographic findings of the baseline survey of the NEDICES cohort: adoor-to-door survey of neurological disorders in three communities from Central. Spain. Public Health 118, 426-33
[8] Bermejo-Pareja F, Benito-Leon J, Vega S, Medrano MJ, Roman GC; on behalf of the Neurological Disorders in Central Spain (NEDICES) Study Group( 2008) Incidence and subtypes of dementia in three elderly populations of central Spain. J Neurol Sci 264, 63-72
[9] Shulman KI (2000) Clock-drawing: Is it the ideal cognitive screening test? Int J Geriatr Psychiatry 15, 548–561
[10] Cacho J, García-García R, Arcaya J, Vicente JL, Lantada N (1999) A proposal for the application and scoring of the clock drawing test in Alzheimer’s disease (in Spanish). Rev Neurol 28, 648–655.