
27 February 2024
I want to comment on the paper by Costa and colleagues on a Bayesian re-analysis of the Lecanemab phase 3 Clarity trial [1]. Costa and colleagues had already very meritoriously presented a Bayesian meta-analysis of the Aducanumab Phase 3 trials [2]. They contribute to a growing field of research that adopts Bayesian approaches to overcome limitations of frequentist p-value based statistical inference [3].
I was able to easily replicate the Bayesian part of their calculations in the JASP software (version 0.18.3). However, I have questions about their calculation of the effect size estimate (expressed as a T value), which produced results that strongly contradict the results of the frequentist analysis presented in the Clarity study [4].
Their effect size estimate was based on the mean difference (MD) of the Clinical Dementia Rating sum of boxes (CDR-SB) between treatment groups and the confidence interval (CI) of the treatment effect, reported in the Clarity study [4]. The MD was -0.45 CDR-SB points and the CI of the treatment effect was |-0.67- -0.23|= 0.44 CDR-SB points [4]. From the confidence interval, Costa and colleagues derived the standard error (SE): “The effect size was obtained from the data by the mean difference of the CDR-SB and the corresponding confidence interval (CI) calculated using classical formula as described in Higgins et al.” [5]. On page 149, Higgins et al. write: “the SE can be calculated as upper limit−lower limit /3.92” [5]. This means, SE = |upper limit of the 95% CI − lower limit of the 95% CI| /(2*1.96), with 1.96 representing the z-score that cuts off the upper 2.5% of the area under the standard normal curve. In other words, the width of the 95% CI = 2*SE* z(p < 0.025), when one assumes that the data generation process followed a Gaussian distribution ([6], Section 9.5). With smaller number of cases (below about 120), one can rather assume a data generation process that follows a t-distribution. Then, the width of the 95% CI becomes ([6], Section 9.5):
95% CI = 2* SE* t(df, p < 0.025), with t indicating the t-distribution and df the degrees of freedom.
With the large number of cases in the Clarity study (n > 1,600), the estimate of SE becomes:
SE = |upper threshold 95%CI - lower threshold 95%CI|/(2* z(p < 0.025)), i.e. 0.44/(2*1.96) = 0.11.
This is different from the value of 0.22 for the SE reported by Costa and colleagues, and it is not clear how they arrived at this larger estimate of variance. Using the SE estimate of 0.11 derived from the Higgins et al. [5] formula, the T-value becomes:
T = MD/SE = -0.45/0.11 = -4, instead of a T-value of -2 as reported by Costa and colleagues [1].
This result is essentially unchanged if one assumes a t-distribution rather than a Gaussian distribution for the data generation process to estimate the limits of the CI. For 120 cases, the difference would be a factor of z(p< 0.025)/t(df= 120, p < 0.025) = 1.96/1.98, i.e. the width of the 95% CI would have been underestimated by a factor of 0.9898 when assuming a Gaussian rather than a t-distribution. With larger df, as is the case for Clarity [4] with more than 1,600 cases, this factor approximates 1. Thus, given the sample size, the assumption of a t-distribution or Gaussian distribution for the data generation process has no effect on the estimate of the SE and effect size.
The Bayes factor in favor of the null hypothesis (BF01) resulting from the T value of -4.00 calculated according to Higgins et al. [5] and a standard Cauchy prior was 0.007, indicating very strong evidence in favor of a treatment effect, i.e., the Bayes factor in favor of a treatment effect (BF10) was 1/0.007 = 145.3. The Bayes factor robustness check, shown in Fig. 1, suggests that this result was robust to different specifications of the standard Cauchy prior.
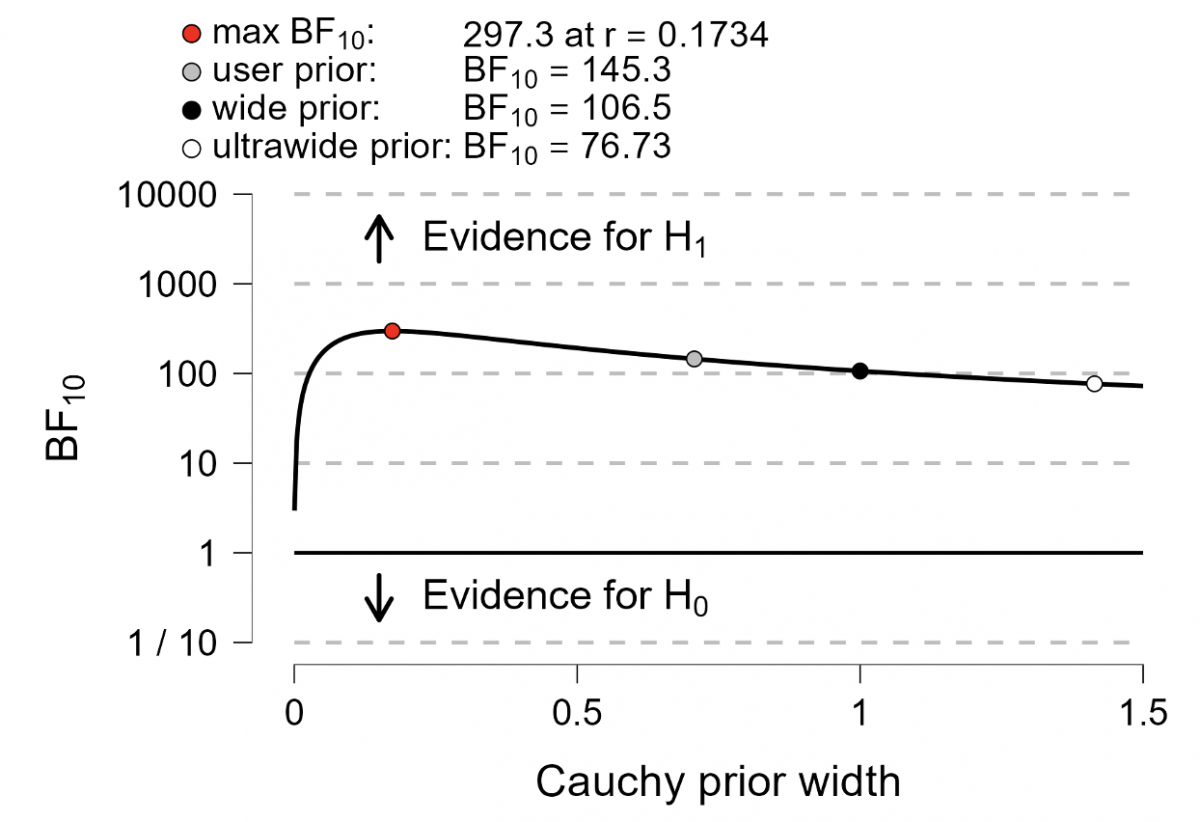
Fig. 1. Bayes factor robustness check. Bayes Factor (BF) values for different prior widths (r), including the default prior width (r = 0.707), wide prior (r = 1), and ultrawide prior (r = 1.4). The evidence for the alternative hypothesis remains relatively stable across the wide range of prior distributions, indicating the robustness of the analysis.
As shown in Table 1, the evidence was also strongly in favor of a treatment effect when using informed prior t-distributions with various minimally clinically important differences (MCID) in favor of placebo, as proposed by Costa et al. [1]. Our results are generally consistent with the conclusion of the frequentist analysis presented in the Clarity study [4], which suggested a very low probability of p < 0.001 of finding the observed effect or an even more extreme effect in future replications of the study, assuming that no effect exists.
Table 1. Bayes factor derived using informed prior t-distributions. Bayes factor in favor of the alternative hypothesis of a treatment effect (BF10). The BF10 is calculated for prior t-distributions assuming various minimally clinically important differences (MCID) in favor of placebo.
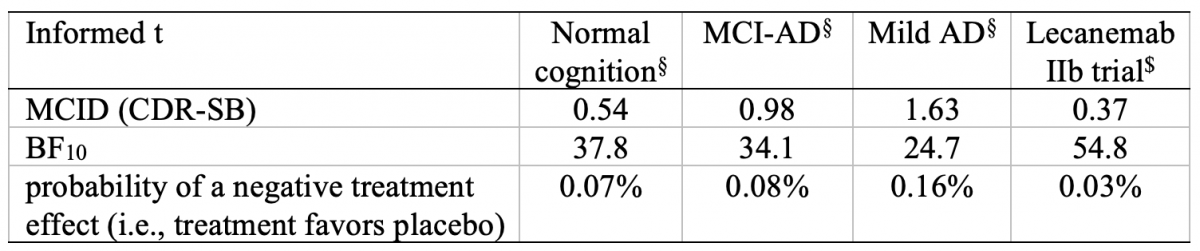
§Estimates for the MCID in the CDR-SB for people with normal cognition, people with mild cognitive impairment due to Alzheimer’s disease (MCI-AD), and people with mild AD dementia reported by [8].
$MCID estimate derived from the effect size reported in the Lecanemab 2b BAN2401-G000-201 trial [9].
Of note, neither the Bayes factor nor the p-value allow direct inference on the size of the underlying effect. The Bayes factor quantifies the evidence in favor of the alternative hypothesis that an effect exists vs. the null hypothesis that an effects does not exist, given the data. In contrast, the p-value quantifies the probability of observing the same effect or an even more extreme effect in future experiments, provided that the assumption of the absence of an effect is correct [7]. Thus, the Bayes factor provides a more intuitive interpretation than the p-value, but often Bayesian and frequentist analyses do not lead to substantially different conclusions. The impression that the Bayesian analysis led to a substantially different conclusion than the frequentist analysis of the Clarity data in the paper by Costa and colleagues [1] resulted from their inflated calculation of the SE estimate, which yielded about half the effect size that can be derived using classical formulas under either assumption, a Gaussian or a t-distribution of the data generation process. Of course, this does not undermine the advantage of the Bayesian approach in providing direct estimates of the plausibility of the presence of an effect given the observed data. However, the authors should explain why and how they arrived at such an inflated estimate of the SE, leading to half of the effect size that would have resulted based on the Higgins et al. [5] formulas, which they cite in their paper.
Stefan Teipel, Deutsches Zentrum für Neurodegenerative Erkrankungen (DZNE) Rostock, Rostock, Germany, and Department of Psychosomatic Medicine University Medicine Rostock, Rostock, Germany. E-mail: stefan.teipel@med.uni-rostock.de
Conflict of Interest:
S.T. has served on advisory boards for Lilly, Eisai, and Biogen and is a member of the Independent Data Safety and Monitoring Board for the ENVISION trial (Biogen).
References:
[1] Costa T, Premi E, Liloia D, Cauda F, Manuello J (2023) Unleashing the power of Bayesian re-analysis: Enhancing insights into lecanemab (Clarity AD) phase III trial through informed t-test. J Alzheimers Dis 95, 1059-1065.
[2] Costa T, Cauda F (2022) A Bayesian reanalysis of the phase III aducanumab (ADU) trial. J Alzheimers Dis 87, 1009-1012.
[3] Goodman S (2008) A dirty dozen: Twelve P-value misconceptions. Semin Hematol 45, 135-140.
[4] van Dyck CH, Swanson CJ, Aisen P, Bateman RJ, Chen C, Gee M, Kanekiyo M, Li D, Reyderman L, Cohen S, Froelich L, Katayama S, Sabbagh M, Vellas B, Watson D, Dhadda S, Irizarry M, Kramer LD, Iwatsubo T (2023) Lecanemab in early Alzheimer's disease. N Engl J Med 388, 9-21.
[5] Higgins JPT, Cochrane Collaboration (2020) Cochrane handbook for systematic reviews of interventions, Wiley-Blackwell, Hoboken, NJ.
[6] Rees DG (2001) Essential Statistics, Chapman and Hall/CRC, New York.
[7] Temp AGM, Lutz MW, Trepel D, Tang Y, Wagenmakers EJ, Khachaturian AS, Teipel S (2021) How Bayesian statistics may help answer some of the controversial questions in clinical research on Alzheimer's disease. Alzheimers Dement 17, 917-919.
[8] Andrews JS, Desai U, Kirson NY, Zichlin ML, Ball DE, Matthews BR (2019) Disease severity and minimal clinically important differences in clinical outcome assessments for Alzheimer's disease clinical trials. Alzheimers Dement (N Y) 5, 354-363.
[9] Swanson CJ, Zhang Y, Dhadda S, Wang J, Kaplow J, Lai RYK, Lannfelt L, Bradley H, Rabe M, Koyama A, Reyderman L, Berry DA, Berry S, Gordon R, Kramer LD, Cummings JL (2021) A randomized, double-blind, phase 2b proof-of-concept clinical trial in early Alzheimer's disease with lecanemab, an anti-Abeta protofibril antibody. Alzheimers Res Ther 13, 80.


Comments
Response
We thank Prof. Stefan Teipel, author of the Letter to the Editor, for his comment on our recently published Research Article [1], as well as for appreciating our previous Bayesian meta-analysis of the Aducanumab Phase 3 trials [2]. We also express our gratitude to the Editor-in-Chief for granting us the opportunity to clarify the point raised.
The criticism of our work pertains to the calculation of the effect size estimate, which yields results contradicting those of the frequentist analysis presented in the study by van Dyck et al. [3]. Specifically, the author contends that we derived an inflated estimate of standard error (i.e., 0.22 instead of 0.11), resulting in half of the effect size that would have been obtained based on the formulas by Higgins et al. [4].
While we acknowledge the accuracy of the author's implementation of the standard error calculation for the specific scenario targeting the determination of a two-tailed interval in a hypothesis test, it is crucial to highlight a fundamental aspect of our methodology. In our study, we opted for a Bayes Factor analysis for superiority design [5], aiming to assess whether the alternative hypothesis is greater than the null hypothesis (rather than simply being different from it). Indeed, as stated in our work, “the research question of interest ... was whether there is a significant difference in the primary endpoint (CDR-SB) favoring lecanemab at 18 months” [1]. From a methodological point of view, a superiority design inherently requires a one-tailed test [5], thus necessitating the utilization of a standard error set at 0.22.
We are grateful to the author for affording us the opportunity to elucidate why and how we arrived at the estimation of the standard error of 0.22 in our study. In essence, our comment underscores the validity of our results within the framework of the design system we employed.
Tommaso Costaa,b,c, Enrico Premid, Donato Liloiaa,b, Franco Caudaa,b,c, Jordi Manuelloa,b
aGCS-fMRI, Koelliker Hospital and Department of Psychology, University of Turin, Turin, Italy bFOCUSLAB, Department of Psychology, University of Turin, Turin, Italy
cNeuroscience Institute of Turin, Turin, Italy
dStroke Unit, Department of Neurological and Vision Sciences, ASST Spedali Civili, Brescia, Italy
Conflict of Interest
None
References
[1] Costa T, Premi E, Liloia D, Cauda F, Manuello J (2023) Unleashing the power of Bayesian re-analysis: enhancing insights into lecanemab (Clarity AD) phase III trial through informed t-test. J Alzheimers Dis 95, 1059-1065.
[2] Costa T, Cauda F (2022) A Bayesian reanalysis of the phase III aducanumab (ADU) trial. J Alzheimers Dis 87, 1009–1012.
[3] van Dyck CH, Swanson CJ, Aisen P, Bateman RJ, Chen C, Gee M, Kanekiyo M, Li D, Reyderman L, Cohen S, Froelich L, Katayama S, Sabbagh M, Vellas B, Watson D, Dhadda S, Irizarry M, Kramer LD, Iwatsubo T (2023) Lecanemab in early Alzheimer’s disease. N Engl J Med 388, 9–21.
[4] Higgins JP, Thomas J, Chandler J, Cumpston M, Li T, Page M, Welch VA (2019) Cochrane handbook for systematic reviews of interventions, John Wiley & Sons.
[5] van Ravenzwaaij D, Monden R, Tendeiro JN, Ioannidis JP (2019) Bayes factors for superiority, non-inferiority, and equivalence designs. BMC Med Res Methodol 19, 71.
Response
I would like to thank Dr. Liloia and colleagues for their clarification. Contrary to their argument, however, I do not see how the decision to use a one-tailed rather than a two-tailed test of superiority would affect the estimate of the standard error (SE) and the resulting value of the T statistic. Of course, it affects the p-value or the Bayes factor. Dr. Liloia and colleagues cite van Ravenzwaaij et al. [1]. When one follows these authors [1], the SE estimate is based on the confidence interval (CI) as follows:
SE = (0.5*width of the two-sided CI)/ t(df, p < 0.025).
Applying this formula to the data of the Lecanemab trial [2] data yields:
SE = 0.5*|-0.67- -0.23|/ t(df, p < 0.025) = 0.22/1.96 = 0.11.
This gives a T statistic of -0.45/0.11= -4.
The SE estimate of a measurement is not affected by the decision to use a one-tailed or two-tailed superiority test. For the frequentist analysis, the one-tailed vs. two-tailed decision affects the selection of the critical t-value. For the Bayesian analysis in the JASP software (version 0.18.3), the T-statistic of -4 yields a Bayes factor for the two-tailed difference of Lecanemab vs. placebo (i.e., undirected effect) of 145.3. For the one-tailed superiority test under the assumption that Lecanemab is superior to placebo (directional effect in favor of Lecanemab), the Bayes factor is 286.5, and for the one-tailed superiority test under the assumption that placebo is superior to Lecanemab (directional effect in favor of placebo), the Bayes factor is 0.01. Using the formula of van Ravenzwaaij et al. [1], we thus obtain a Bayesian estimate that is consistent with the frequentist result and indicates extreme evidence in favor of a superior effect of the active compound and extreme evidence against a superior effect of placebo. The estimate of both the frequentist p-value and the Bayes factor are affected by the decision to use a one-tailed or two-tailed test, but the estimate of the SE is not.
Conflict of Interest:
S.T. has served on advisory boards for Lilly, Eisai, and Biogen and is a member of the Independent Data Safety and Monitoring Board for the ENVISION trial (Biogen).
References:
[1] van Ravenzwaaij D, Monden R, Tendeiro JN, Ioannidis JPA (2019) Bayes factors for superiority, non-inferiority, and equivalence designs. BMC Med Res Methodol 19, 71.
[2] van Dyck CH, Swanson CJ, Aisen P, Bateman RJ, Chen C, Gee M, Kanekiyo M, Li D, Reyderman L, Cohen S, Froelich L, Katayama S, Sabbagh M, Vellas B, Watson D, Dhadda S, Irizarry M, Kramer LD, Iwatsubo T (2023) Lecanemab in early Alzheimer's disease. N Engl J Med 388, 9-21.

- Comment
|