
1 March 2013
We have read with great interest the study by Rembach and colleagues [1] on the diagnostic value of serum copper (Cu), ceruloplasmin (CP), and ‘free’ Cu also named non-CP Cu, in the Australian Imaging Biomarkers and Lifestyle Study of Aging (AIBL). When discussing their results, these authors commented that some studies of ours on the relationship between serum non-CP Cu and Alzheimer’s disease (AD) [2-8] were produced in cohorts not adjusted for age and gender. Actually, our studies were all adjusted for age and gender, and finally they involved a large population of more than 860 individuals [9]. In fact, to date we have collected Cu studies from a cohort of about 300 healthy controls, 400 AD, and 169 mild cognitive impairment (MCI) subjects. Specifically, beginning with our studies in 2002, we have used “laboratory reference sera” in every Cu and CP experimental run in addition to the standard controls provided by manufacturers. This procedure allowed us to merge data obtained in different runs during different years. Expressively, we have created a set of five pooled sera from about 20 healthy individuals, well defined in terms of Cu and CP, and we have divided these control pooled sera into thousands of aliquots, stored them at -80°C, and tested them in every run. As reported [9], the descriptive statistics of this merged dataset indicated: healthy controls (n=303; non-CP Cu mean=0.25, SD=2.32 µmol/L), AD patients (n=399; non-CP Cu mean=2.27, SD=2.29 µmol/L), and MCI subjects (n=169; Non-CP Cu mean=1.36, SD=2.13 µmol/L). After adjusting for age and gender through a general linear model, the estimates were as follows: healthy mean=0.20 (95% CI=-0.09, +0.492), AD mean=2.18 (95% CI=1.91, 2.23), MCI mean=1.38 (95% CI=1.04; 1.73) with each pairwise comparison clearly significant (p<0.001 after Bonferroni correction).
Moreover, when Rembach et al. [1] considered age and gender as covariates in their statistical models, their relationships observed between non-CP Cu and disease status were all abrogated, so their conclusion (see the Abstract) of decreased levels of non-CP Cu in MCI and AD appears not sustained by their data.
In all previous studies on this matter, the authors have used the equation published by Walshe to calculate non-CP Cu [10]. Rembach et al. [1] questioned this equation because its utilization in the AIBL cohort produced mostly non-CP Cu values in the negative range. Specifically, they reported that the Walshe equation assumes that the amount of Cu in CP is 0.3% g/g, which they refer to be equal to 7.1 moles of Cu/CP. Actually, Walshe [10] clearly reported that the number of atoms (moles) of Cu in CP are 6 (in particular, 0.3% g/g of Cu in Cp corresponds exactly to 6.23 atoms which can be approximated to 6) and, thereby, their concern about the Walshe equation and its utilization appear not pertinent. From the above, equation #1 of Rembach et al. (which is actually the Walshe’s equation [10]) and equation #2, which these authors report to be derived from:
[CP copper]=[CP mole/L]*6 moles of copper/CP mole [1],
are the same, as follows:
CP-Cu1(µM)=CP (mg/L) * 1000 *(0.3/100)*[1/63.6 (g/mol)]=
=CP (mg/dL) *10*1000* (0.3/100)*[1/63.6(g/mol)]=
= CP (mol/L)* (6moles Cu/1moles Cp) *10(6)
So, also non-CP Cu (µM)1 and non-CP Cu (µM)2 reported in Table 2 by Rembach et al. [1] should be the same, differently from what is reported. Moreover, 50% of the control non-CP Cu values calculated with equation #2 are higher than the normal reference range reported for healthy controls [10].
The diverse results obtained by Rembach et al. [1] in terms of non-CP Cu in comparison with all the previous studies published [3, 5, 8, 11-17] can more likely be related to the diverse values of CP measured in the AIBL cohort. As a matter of fact, if one considers all the studies published in 1983 through January 2013 on Cu and CP measurements in AD and control individuals [3, 5, 8, 11-17], the mean value of non-CP for healthy controls is in the positive range. This is not true for the Rembach et al. study [1], which finds a negative mean value (Table 1).
Twomey et al. [18] proposed 6.6 as the theoretical optimal mean value of the Cu:CP ratio in healthy subjects. This ratio is an index of the accordance of the Cu and CP pair for each serum measurement. As reported in Table 1, the Cu:CP ratio for the Rembach et al. study [1] is lower than 6.6, which indicates an underestimation of Cu with respect to CP values, pointing out that in the AIBL study, the CP values are not in line with the other studies. Genetic factors may account for this difference which seems to move the AIBL CP values toward higher values, especially in relation to total serum Cu. In particular, ethnicity may explain this evidence. As described by the AIBL group, Australia is a geographically isolated country with a different ethnic mix and AIBL participants reflected this admixture [19]. Serum CP levels are affected by genetics [20]. Several studies have demonstrated that genetic variation among human populations is associated with significant functional differences in health-related aspects [21]. Among human populations, Australians showed a very complex genetic structure [22], which, thereby, may explain the differences between AIBL CP values and those from the other studies. Otherwise, existing CP concentration methods are not standardized [23]. On this basis, we can conclude that the data showed by the AIBL study are not sufficient to sustain the authors’ statement that non-CP Cu is not a robust discriminator for AD. More precisely, we agree with them that the calculation is composite; it is susceptible to Cu, CP, and their reciprocal variations which should move in concert to fit their physiological interaction. In other words, as depicted in this Letter to the Editor, the main problem concerns the calculations and not the occurrence of a Cu dysfunction in AD. This is why we have developed a direct fluorescent assay to measure serum non-CP Cu [9]. This assay uses a coumarin fluorescent probe, for which a decay in fluorescence emission is recorded when it binds [Cu++]. This probe allows one to overcome the weakness of the non-CP Cu calculation and the uncertainty of the results.
Rosanna Squittia,b, Patrizio Pasqualettic, Mariacristina Siottod, Renato Polimantie, Mariacarla Ventrigliaa,b, Nicola Colabufof
aDepartment of Neuroscience, AFaR – Fatebenefratelli Hospital, Isola Tiberina, Rome, Italy
bDepartment of Neurology, “Campus Biomedico” University, Rome, Italy
cMedical Statistics & Information Technology, AFaR – Fatebenefratelli Hospital, Isola Tiberina,
Rome, Italy
dDon Carlo Gnocchi Foundation ONLUS, Milan, Italy
eDepartment of Biology, University of Rome “Tor Vergata”, Rome, Italy
fDipartimento Farmacia, Università degli Studi di Bari ALDO MORO, Bari, Italy
Copper (Cu), ceruloplasmin (CP), CP-bound copper (CP-Cu), non-CP-bound copper (Non-CP Cu), and Cu:CP ratio in healthy subjects as reported in all the studies published from 1983 through January 2013 on Cu and CP measurements in Alzheimer’s disease and control individuals.
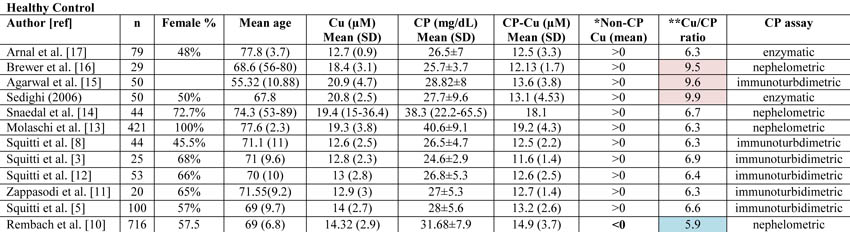
*Data concerning CP-Cu have been calculated following the Walshe equation [10]. Non-CP Cu was calculated by subtracting CP-Cu from Cu as reported by Walshe [10] and expressed in terms of negative or positive values. The Rembach et al. study [1] is the only study reporting mean value <0.
**Cu:CP ratio is calculated as reported in Twomey et al. [18]. These authors provide the equation as follows:
[copper µM]* [132000 g/mol]/[ CPmg/dL*10(4)]
Twomey et al. [18] propose that 6.6 is the theoretical optimal mean value of this ratio in healthy subjects. In Table 1, the values consistently higher than 6.6 are reported in pale pink, and they represent an overestimation of copper with respect to CP values. Values consistently lower than 6.6 are represented in pale blue and represent an underestimation of copper with respect to CP values.
References
[1] Rembach A, Doecke JD, Roberts BR, Watt AD, Faux NG, Volitakis I, Pertile KK, Rumble RL, Trounson BO, Fowler CJ, Wilson W, Ellis KA, Martins RN, Rowe CC, Villemagne VL, Ames D, Masters CL, Bush AI (2013) Longitudinal analysis of serum copper and ceruloplasmin in Alzheimer's disease. J Alzheimers Dis34, 171-182.
[2] Salustri C, Squitti R, Zappasodi F, Ventriglia M, Bevacqua MG, Fontana M, Tecchio F (2010) Oxidative stress and brain glutamate-mediated excitability in depressed patients. J Affect Disord 127, 321-325.
[3] Squitti R, Barbati G, Rossi L, Ventriglia M, Dal Forno G, Cesaretti S, Moffa F, Caridi I, Cassetta E, Pasqualetti P, Calabrese L, Lupoi D, Rossini PM (2006) Excess of nonceruloplasmin serum copper in AD correlates with MMSE, CSF [beta]-amyloid, and h-tau. Neurology 67, 76-82.
[4] Squitti R, Bressi F, Pasqualetti P, Bonomini C, Ghidoni R, Binetti G, Cassetta E, Moffa F, Ventriglia M, Vernieri F, Rossini PM (2009) Longitudinal prognostic value of serum "free" copper in patients with Alzheimer disease. Neurology 72, 50-55.
[5] Squitti R, Ghidoni R, Scrascia F, Benussi L, Panetta V, Pasqualetti P, Moffa F, Bernardini S, Ventriglia M, Binetti G, Rossini PM (2011) Free copper distinguishes mild cognitive impairment subjects from healthy elderly individuals. J Alzheimers Dis 23, 239-248.
[6] Squitti R, Lupoi D, Pasqualetti P, Dal Forno G, Vernieri F, Chiovenda P, Rossi L, Cortesi M, Cassetta E, Rossini PM (2002) Elevation of serum copper levels in Alzheimer's disease. Neurology 59, 1153-1161.
[7] Squitti R, Pasqualetti P, Cassetta E, Dal Forno G, Cesaretti S, Pedace F, Finazzi-Agro A, Rossini PM (2003) Elevation of serum copper levels discriminates Alzheimer's disease from vascular dementia. Neurology 60, 2013-2014.
[8] Squitti R, Pasqualetti P, Dal Forno G, Moffa F, Cassetta E, Lupoi D, Vernieri F, Rossi L, Baldassini M, Rossini PM (2005) Excess of serum copper not related to ceruloplasmin in Alzheimer disease. Neurology 64, 1040-1046.
[9] Colabufo N, Squitti R (2012) Patent: Method and kit for determination of free copper in serum. European Patent Office (EPO) (RO/EP), Patent number: PCT-SAFE Version 3.51.056.232 MT/FOP 20121001/0.20.5.19
[10] Walshe JM (2003) Wilson's disease: the importance of measuring serum caeruloplasmin non-immunologically. Ann Clin Biochem 40, 115-121.
[11] Zappasodi F, Salustri C, Babiloni C, Cassetta E, Del Percio C, Ercolani M, Rossini PM, Squitti R (2008) An observational study on the influence of the APOE-epsilon4 allele on the correlation between 'free' copper toxicosis and EEG activity in Alzheimer disease. Brain Res 1215, 183-189.
[12] Squitti R, Ventriglia M, Barbati G, Cassetta E, Ferreri F, Dal Forno G, Ramires S, Zappasodi F, Rossini PM (2007) 'Free' copper in serum of Alzheimer's disease patients correlates with markers of liver function. J Neural Transm 114, 1589-1594.
[13] Molaschi M, Ponzetto M, Bertacna B, Berrino E, Ferrario E (1996) Determination of selected trace elements in patients affected by dementia.Arch Gerontol Geriatr 22 Suppl 1, 39-42.
[14] Snaedal J, Kristinsson J, Gunnarsdottir S, Olafsdottir, Baldvinsson M, Johannesson T (1998) Copper, ceruloplasmin and superoxide dismutase in patients with Alzheimer's disease . a case-control study. Dement Geriatr Cogn Disord 9, 239-242.
[15] Agarwal R, Kushwaha SS, Tripathi CB, Singh N, Chhillar N (2008) Serum copper in Alzheimer's disease and vascular dementia. Indian J Clin Biochem 23, 369-374.
[16] Brewer GJ, Kanzer SH, Zimmerman EA, Celmins DF, Heckman SM, Dick R (2010) Copper and ceruloplasmin abnormalities in Alzheimer's disease. Am J Alzheimers Dis Other Demen 25, 490-497.
[17] Arnal N, Cristalli DO, de Alaniz MJ, Marra CA (2010) Clinical utility of copper, ceruloplasmin, and metallothionein plasma determinations in human neurodegenerative patients and their first-degree relatives. Brain Res 1319, 118-130.
[18] Twomey PJ, Viljoen A, House IM, Reynolds TM, Wierzbicki AS (2007) Copper:caeruloplasmin ratio. J Clin Pathol 60, 441-442.
[19] Gardener S, Gu Y, Rainey-Smith SR, Keogh JB, Clifton PM, Mathieson SL, Taddei K, Mondal A, Ward VK, Scarmeas N, Barnes M, Ellis KA, Head R, Masters CL, Ames D, Macaulay SL, Rowe CC, Szoeke C, Martins RN (2012) Adherence to a Mediterranean diet and Alzheimer's disease risk in an Australian population. Transl Psychiatry 2, e164.
[20] Tang WH, Hartiala J, Fan Y, Wu Y, Stewart AF, Erdmann J, Kathiresan S, Roberts R, McPherson R, Allayee H, Hazen SL (2012) Clinical and genetic association of serum paraoxonase and arylesterase activities with cardiovascular risk. Arterioscler Thromb Vasc Biol 32, 2803-2812.
[21] Polimanti R, Piacentini S, Manfellotto D, Fuciarelli M (2012) Human genetic variation of CYP450 superfamily: analysis of functional diversity in worldwide populations. Pharmacogenomics 13, 1951-1960.
[22] Ballantyne KN, van Oven M, Ralf A, Stoneking M, Mitchell RJ, van Oorschot RA, Kayser M (2012) MtDNA SNP multiplexes for efficient inference of matrilineal genetic ancestry within Oceania. Forensic Sci Int Genet 6, 425-436.
[23] Infusino I, Valente C, Dolci A, Panteghini M (2010) Standardization of ceruloplasmin measurements is still an issue despite the availability of a common reference material. Anal Bioanal Chem 397, 521-525.


Comments
Response to Squitti et al.
Response to Squitti et al.
We appreciate that Dr. Squitti and colleagues have published data previously that may appear at variance with our findings published in the article “Longitudinal analysis of serum copper and ceruloplasmin in Alzheimer’s disease.” [1] Our responses to the authors’ list of concerns are detailed below.
“…these authors commented that some studies of ours on the relationship between serum non-CP Cu and Alzheimer’s disease (AD) [2-8] were produced in cohorts not adjusted for age and gender. Actually, our studies were all adjusted for age and gender, and finally they involved a large population of more than 860 individuals [9]…”
Squitti and colleagues cite an analysis they performed involving pooling of data from their multiple studies that they adjusted for age and gender in a general linear model. However, their analysis was not published in the peer-reviewed literature, but rather in a patent application, which we did not have access to at the time of publication. Despite the caveat of analyzing pooled data from multiple studies, in contrast to our analysis of one large cohort, we are willing to accept that their meta-analysis reveals differences that survive adjustment for age and gender, at variance with our findings.
“…when Rembach et al. [1] considered age and gender as covariates in their statistical models, their relationships observed between non-CP Cu and disease status were all abrogated, so their conclusion (see the Abstract) of decreased levels of non-CP Cu in MCI and AD appears not sustained by their data…”
Our abstract states that there was “…a near-significant decrease in non-CP copper in the mild cognitive impairment and AD groups at baseline (p = 0.02) that was significant at 18-months (p = 0.003).” These were the only changes we could find at all between clinical groups, hence they were highlighted in the abstract. The abstract did not contend that these differences were of adjusted data, and Squitti and colleagues are correct in that adjustment abrogated the significance of the changes, as reported in the results.
“…they reported that the Walshe equation assumes that the amount of Cu in CP is 0.3% g/g, which they refer to be equal to 7.1 moles of Cu/CP. Actually, Walshe [10] clearly reported that the number of atoms (moles) of Cu in CP are 6 (in particular, 0.3% g/g of Cu in Cp corresponds exactly to 6.23 atoms which can be approximated to 6…”
The stoichiometric ratio of Cu bound to CP in the studies of Squitti and colleagues is based on the assumption of 0.3 g Cu per g CP. Indeed this equates to 6.23 atoms, and we thank Squitti and colleagues for pointing out that we were in error to calculate a molar ratio of 7.1 based on Walshe’s assumption. However, this does not change any of our conclusions regarding changes in serum Cu, CP, or non-CP Cu in AD. We are concerned by the impact of rounding the moles of copper to 6 based on 0.3% g/g, when it is possible that some CP is occupied by 7 coppers [2]. Indeed, a recent direct measure of CP using size exclusion inductively coupled mass spectrometry indicates that 6-7 Cu per CP molecule exist [3]. It is also possible that some CP exists in serum/plasma with <6 moles of Cu, however, such species are likely to be relatively short-lived (vide infra). Regardless of whether one uses 0.3% (6.23 moles of Cu/mole of CP) or 6 moles of Cu/CP or 7.1 moles of Cu/CP, the constant used does not change the dimension of the differences for non-CP Cu between each clinical group, or our overall conclusion that non-CP Cu might be decreased in AD, and is certainly not increased in our cohort. We have indeed re-analyzed our data with the 6.23 Cu per CP as the constant, and, as expected, our conclusions remain unchanged. Changing this constant slightly changes the distribution of the data, but does not change the outcome.
In any case, calculation of non-CP Cu using any constant for Cu binding to CP makes an assumption that Cu in serum/plasma is either bound to CP or unbound, and this is not true. There are other abundant Cu binding proteins in serum/plasma including transcuprein (5-15%), albumin (15-20%), low molecular weight complexes (2-5%), so that CP accounts for only 60-70% of the total Cu in the periphery [4]. The non-CP Cu estimation procedure is not a direct measure, as Squitti and colleagues concede. In Wilson’s disease, where perturbation of copper loading into CP is profound, calculating ‘free Cu” is relevant and appropriate, but for AD we could not corroborate such an elevation. Thus, the only way to make any conclusions about the level of Cu in serum/plasma fractions other than CP or in CP itself, is to directly measure them.
“…non-CP Cu (µM)1 and non-CP Cu (µM)2 reported in Table 2 by Rembach et al. [1] should be the same, differently from what is reported …”
The non-CP Cu estimation subtracts the concentration of Cu assumed to bind to CP from the total Cu in the serum. The values for CP concentration and for total serum Cu are known, but the amount of Cu attributed to CP binding is assumed. In Table 2, we tested two assumptions (7.1 versus 6) about the stoichiometry of Cu binding to CP. The residual “non-CP Cu” must certainly be different depending on the assumption of stoichiometry.
“…50% of the control non-CP Cu values calculated with equation #2 are higher than the normal reference range reported for healthy controls [10]…”
Walshe [5] described that “…the normal concentration of free copper is around 1.6 µM…”. The article does not provide a reference range. Our estimated values assuming 6 moles of Cu per CP were 1.76 µM at baseline and 0.96 µM 18-months later for the control group. This is not far from Walshe’s estimates. Were we to assume, as Walshe did, a stoichiometric ratio of 6.23, these mean values would be slightly lower, but our conclusions would not change.
“…if one considers all the studies published in 1983 through January 2013 on Cu and CP measurements in AD and control individuals [3, 5, 8, 11-17], the mean value of non-CP for healthy controls is in the positive range. This is not true for the Rembach et al. study [1], which finds a negative mean value (Table 1)….”
The contested values are actually reported in Table 2 of Rembach et al. [1], not Table 1. In Table 2, we report positive non-CP Cu values using an assumption of 6 Cu per CP. The negative values were due to the assumption of 7.1 moles of Cu per CP. We agree that the positive values have more validity, and we report in the paper that we use the positive values for non-CP Cu (generated by the 6 Cu per CP assumption) as the basis for our conclusions.
“…Twomey et al. [18] proposed 6.6 as the theoretical optimal mean value of the Cu:CP ratio in healthy subjects. This ratio is an index of the accordance of the Cu and CP pair for each serum measurement. As reported in Table 1, the Cu:CP ratio for the Rembach et al. study [1] is lower than 6.6, which indicates an underestimation of Cu with respect to CP values, pointing out that in the AIBL study, the CP values are not in line with the other studies. Genetic factors may account for this difference which seems to move the AIBL CP values toward higher values, especially in relation to total serum Cu. In particular, ethnicity may explain this…”
There is uncertainty in the literature about the average stoichiometry of Cu:CP in serum/plasma. In a subsequent paper, Twomey et al. [6] pointed out discrepancies in the ratios in plasma Cu:CP values of populations measured in three different labs. They concluded that CP assays are not adequately standardized, and that labs should derive their own reference values for CP. We believe that this is a far more likely explanation for our Cu:CP ratio being less than 6.6. Another possible explanation could be the advanced age of our cohort.
We cannot exclude ethnic composition of the cohort as contributing to Cu:CP ratio, but we do not believe that this accounts for the conclusions at variance with those of Squitti and colleagues. Again, whatever value is used as the assumption of Cu:CP stoichiometry in serum/plasma, it is a constant when comparing between clinical groups, which was our overarching aim. Our data shows that no matter what the constant is, the differences between the diagnostic groups indicate a decrease in non-CP Cu in AD.
We agree with Squitti and colleagues that more sophisticated methods are needed to assess whether peripheral Cu or CP are perturbed in AD and whether changes in the periphery are directly linked to the pathological mechanism(s) in AD. Their direct assay for unbound Cu ions may be informative. In addition, a detailed analysis of the functional activity of CP may be informative as there is still some evidence that this protein may be compromised in AD.
We also agree that a range of factors could potentially influence the levels of peripheral Cu and CP, such as diet, lifestyle, and the composition of local drinking water, which are confounding variables that could influence assumptions/interpretations of the data, but unlikely in our opinion to explain the variance between research groups in their appraisal of these values. If measures of Cu or CP are significantly influenced by individual differences in genetics, rather than disease state, then the logical conclusion for this is that peripheral Cu or CP measures are not robust biomarkers for AD. We agree that the Australian community represents a diverse and complex genetic community. However, we would expect that this heterogeneity would be a better test of the utility of Cu or CP measures for discriminating disease classification, when compared to cohorts of more homogenous subjects. Most of the AIBL cohort is Caucasian, and of European descent, so claiming that the isolation of Australia is solely responsible for the derivation in Cu or CP values in our study, is unlikely to be sufficient to explain the variance.
Alan Rembacha,c, James D. Doeckeb,c,d, Blaine R. Robertsa, Ashley I. Busha, for the AIBL Research Groupe
aThe Florey Institute of Neuroscience & Mental Health, The University of Melbourne, VIC, Australia
bThe Australian e-Health Research Centre, Herston, QLD, Australia
cCSIRO Preventative Health Flagship, Molecular Science and Engineering, Parkville, VIC, Australia
dCSIRO Mathematics and Information Sciences, Macquarie University, QLD, Australia
ehttp://www.aibl.csiro.au/
References
[1] Rembach A, Doecke JD, Roberts BR, Watt AD, Faux NG, Volitakis I, Pertile KK, Rumble RL, Trounson BO, Fowler CJ, Wilson W, Ellis KA, Martins RN, Rowe CC, Villemagne VL, Ames D, Masters CL, Bush AI (2012) Longitudinal Analysis of Serum Copper and Ceruloplasmin in Alzheimer's Disease. J Alzheimers Dis.
[2] Bento I, Peixoto C, Zaitsev VN, Lindley PF (2007) Ceruloplasmin revisited: structural and functional roles of various metal cation-binding sites. Acta Crystallogr D Biol Crystallogr 63, 240-248.
[3] Lopez-Avila V, Sharpe O, Robinson WH (2006) Determination of ceruloplasmin in human serum by SEC-ICPMS. Anal Bioanal Chem 386, 180-187.
[4] Barrow L, Tanner MS (1988) Copper distribution among serum proteins in paediatric liver disorders and malignancies. Eur J Clin Invest18, 555-560.
[5] Walshe JM (2003) Wilson's disease: the importance of measuring serum caeruloplasmin non-immunologically. Ann Clin Biochem 40, 115-121.
[6] Twomey PJ, Wierzbicki AS, Reynolds TM, Viljoen A (2009) The copper/caeruloplasmin ratio in routine clinical practice in different laboratories. J Clin Pathol 62, 60-63.
Response to Rembach et al.
Response to Rembach et al.
We thank the Editor who welcomed this debate in the Journal of Alzheimer’s Disease. We really appreciate the reply from Rembach and colleagues; however, these authors have still not clarified the origin of the positive data on non-Cp Cu reported in Table 2 of Reimbach et al. [1]. Specifically, applying their equation #2 (that is actually the same of Walshe [2]), based on the 6 moles of copper for mole of Cp stoichiometry to the data of total Cu and Cp for healthy controls at baseline reported in Table 2 by Rembach et al. [1], the value of non-Cp Cu is:
Non-Cp Cu = total Cu – [Cp-Cu], and in detail:
Cp-Cu (micromolar) = Cp (micromolar) *6 moles of copper/mole of Cp
=2.40*6= 14.4 micromolar of copper bound to Cp, then
Non-CP Cu = 14.32-14.40 = -0.08 micromolar.
This value is very similar to the non-Cp Cu = -0.05 micromolar reported by Reimbach et al. [1] in Table 2; the difference in the exact value can be due to decimal approximation derived by the calculation of the difference of the means of Cu and Cp instead of calculating the means of their differences as we did.
Applying the stoichiometry of 6.23, the Cp-Cu is:
2.40*6.23= 14.95 micromolar, then
Non-CP Cu = 14.32-14.95 = -0.63 micromolar
Finally, applying the stoichiometry of 7.1 (as reported for equation #1 of [1], i.e., considering 7.1 moles of copper/mole of ceruloplasmin), the non-Cp Cu is:
2.40*7.1= 17.4 micromolar, and
Non-CP Cu = 14.32-17.4 = -3.08 micromolar
With any of the stoichiometry Cu-Cp proposed (6, 6.23, 7.1) by the authors, it is possible to achieve the value of 1.76 micromolar for healthy controls at baseline reported in Table 2 [1]. Also considering decimal approximation, the value cannot be derived by the data for Cu and Cp reported in Table 2 applying the equations provided by Reimbach et al. [1]. In fact, 1.76 micromolar is about 200-300% higher than -0.63 micromolar, for example. Rembach and colleagues should clarify the exact calculation they used to obtain 1.76 micromolar starting from Cu = 14.32 micromolar and Cp = 2.40 micromolar. In other words, the positive data reported in Table 2 cannot be obtained applying any of the stoichiometry (7.1 versus 6) for Cu and Cp assumed by the these authors [1], different from what they state in many passages of their answer. Unfortunately, this prevents any possible discussion about the consistency of non-CP Cu in the AIBL study. Also considering the negative values for non-Cp Cu, all discussions are precluded. On this basis, we conclude that we agree with Reimbach et al. [1] concerning their conclusion about total copper in AD and controls. However, their data about non-CP Cu do not allow them to drawn any conclusion about non-Cp Cu, either in terms of increasing, decreasing, or stable levels of non-Cp Cu in AD compared to healthy controls, thus about the ‘robustness’ of non-Cp Cu as a marker for AD. Conversely, the same authors proposed a method to measure labile Cu in the brain [3] which appears superior to the calculation. We also proposed a new method to measure non-Cp Cu in serum [4] and these two can hopefully overcome the non-CP Cu calculation, as Reimbach et al. [1] also agreed, to finally obtain hard data of non-Cp Cu in AD.
Moreover, the fact that Cu or Cp can be influenced by individual differences in genetics, rather than disease state, does not logically lead to the conclusion that peripheral Cu or Cp measures are not robust biomarkers for AD, as the Reimbach et al. stated in their Response.
In fact, recent investigations into complex diseases, such as AD, proposed that multiple and independent pathogenic pathways can lead to the same pathologic condition [5], so multiple factors may account for diverse % of the disease risk in populations with diverse ethnicity or living in diverse environments. For example, our data, also considering age and gender as confounders [4, 6-12], demonstrated that in the Italian population, a Cu dysfunction occurred in about 60% of patients with AD. This is not in contrast with Australian AD patients, who can have a lower percentage of Cu-related phenotype. In Australian AD patients, diverse factors can account for their disease risk.
Hoping to provide the readers with useful information to evaluate the theoretical as well as the practical details and facets of this debate, we recommend them to read all the original articles reported in this correspondence, with particular emphasis on the Walshe [2] and Twomey et al. [13] articles to make their own opinion.
References:
[1] Rembach A, Doecke JD, Roberts BR, Watt AD, Faux NG, Volitakis I, Pertile KK, Rumble RL, Trounson BO, Fowler CJ, Wilson W, Ellis KA, Martins RN, Rowe CC, Villemagne VL, Ames D, Masters CL, Bush AI (2013) Longitudinal analysis of serum copper and ceruloplasmin in Alzheimer's disease. J Alzheimers Dis 34, 171-182.
[2] Walshe JM (2003) Wilson's disease: the importance of measuring serum caeruloplasmin non-immunologically. Ann Clin Biochem 40, 115-121.
[3] James SA, Volitakis I, Adlard PA, Duce JA, Masters CL, Cherny RA, Bush AI (2012) Elevated labile Cu is associated with oxidative pathology in Alzheimer disease. Free Radic Biol Med 52, 298-302.
[4] Colabufo N, Squitti R (2012) Patent: Method and kit for determination of free copper in serum. European Patent Office (EPO) (RO/EP), Patent number: PCT-SAFE Version 3.51.056.232 MT/FOP 20121001/0.20.5.19
[5] von Bernhardi R, Eugenín J (2012) Alzheimer's disease: redox dysregulation as a common denominator for diverse pathogenic mechanisms. Antioxid Redox Signal 16, 974-1031.
[6] Salustri C, Squitti R, Zappasodi F, Ventriglia M, Bevacqua MG, Fontana M, Tecchio F (2010) Oxidative stress and brain glutamate-mediated excitability in depressed patients. J Affect Disord 127, 321-325.
[7] Squitti R, Barbati G, Rossi L, Ventriglia M, Dal Forno G, Cesaretti S, Moffa F, Caridi I, Cassetta E, Pasqualetti P, Calabrese L, Lupoi D, Rossini PM (2006) Excess of nonceruloplasmin serum copper in AD correlates with MMSE, CSF [beta]-amyloid, and h-tau. Neurology 67, 76-82.
[8] Squitti R, Bressi F, Pasqualetti P, Bonomini C, Ghidoni R, Binetti G, Cassetta E, Moffa F, Ventriglia M, Vernieri F, Rossini PM (2009) Longitudinal prognostic value of serum "free" copper in patients with Alzheimer disease. Neurology 72, 50-55.
[9] Squitti R, Ghidoni R, Scrascia F, Benussi L, Panetta V, Pasqualetti P, Moffa F, Bernardini S, Ventriglia M, Binetti G, Rossini PM (2011) Free copper distinguishes mild cognitive impairment subjects from healthy elderly individuals. J Alzheimers Dis 23, 239-248.
[10] Squitti R, Lupoi D, Pasqualetti P, Dal Forno G, Vernieri F, Chiovenda P, Rossi L, Cortesi M, Cassetta E, Rossini PM (2002) Elevation of serum copper levels in Alzheimer's disease. Neurology 59, 1153-1161.
[11] Squitti R, Pasqualetti P, Cassetta E, Dal Forno G, Cesaretti S, Pedace F, Finazzi-Agro A, Rossini PM (2003) Elevation of serum copper levels discriminates Alzheimer's disease from vascular dementia. Neurology 60, 2013-2014.
[12] Squitti R, Pasqualetti P, Dal Forno G, Moffa F, Cassetta E, Lupoi D, Vernieri F, Rossi L, Baldassini M, Rossini PM (2005) Excess of serum copper not related to ceruloplasmin in Alzheimer disease. Neurology 64, 1040-1046.
[13] Twomey PJ, Wierzbicki AS, Reynolds TM, Viljoen A (2009) The copper/caeruloplasmin ratio in routine clinical practice in different laboratories. J Clin Pathol 62, 60-63.

- Comment
|